The example I presented is an updated version of the Boston Bruins Problem, which is in Chapter 7 of my book, Think Bayes. At the end of the talk, I generated a probablistic prediction for the Bruins’ game against the Anaheim Ducks on February 15. I predicted that the Bruins had a 59% chance of winning, which they did, 3-0.
According to the good people at the ACM, there were more than 3000 people registered for the webinar, and almost 900 who watched it live. I’m glad I didn’t know that while I was presenting 🙂
If you did not watch it live, you can view the recorded webinar at no cost other than registering and providing contact information.
Thanks to the ACM Learning Center for inviting me, to Eric for moderating, and to Chris Fonnesbeck and Colin Carroll for their help developing the example I presented.
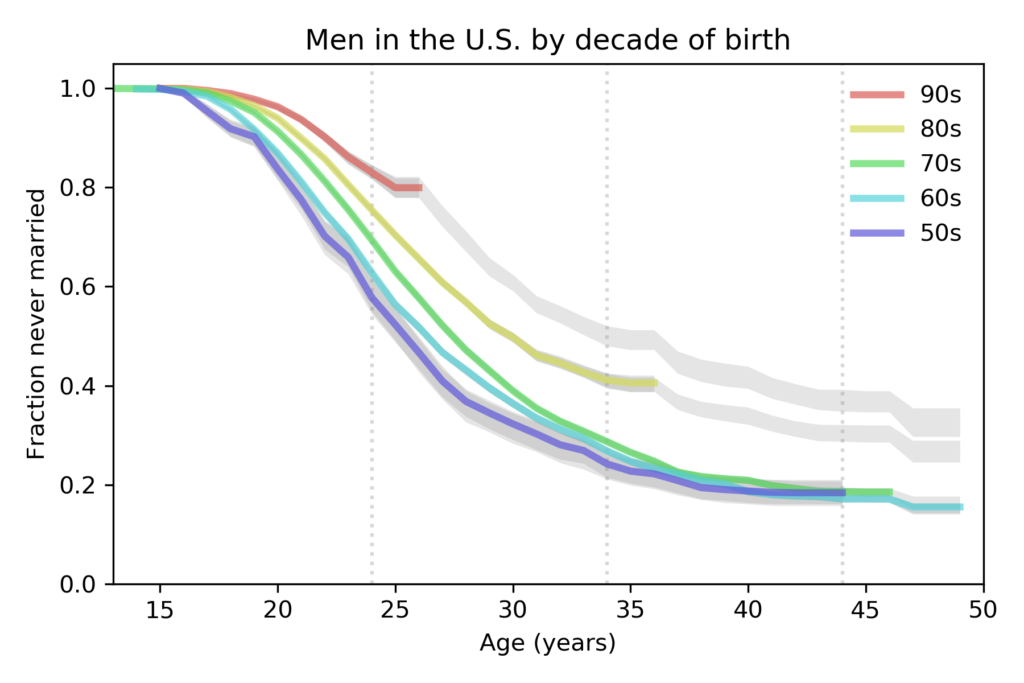
Again, I’m working with data from the National Survey of Family Growth, which surveyed 29,192 men in the U.S. between 2002 and 2017. I used Kaplan–Meier estimation to compute “survival” curves for the time until first marriage. The following figure shows the results for men grouped by decade of birth:
The colored lines show the estimated curves; the gray lines show projections based on moderate assumptions about future marriage rates. Two trends are apparent:
From one generation to the next, men have been getting married later. The median age at first marriage for men born in the 1950s was 26; for men born in the 1980s is it 30, and for men born in the 1990s, it is projected to be 35.
The fraction of men never married at age 44 was 18% for men born in the 1950s, 1960s, and 1970s. It is projected to increase to 30% for men born in the 1980s and 37% for men born in the 1990s.
Of course, thing could change in the future and make these projections wrong. But marriage rates in the last 5 years have been very low for both men and women. In order to catch up to previous generations, young men would have to start marrying at unprecedented rates, and they would have to start soon.
Last month The National Survey of Family Growth released new data from 5,554 respondents interviewed between 2015 and 2017. I’ve worked on several studies using data from the NSFG, so it’s time to do some updates!
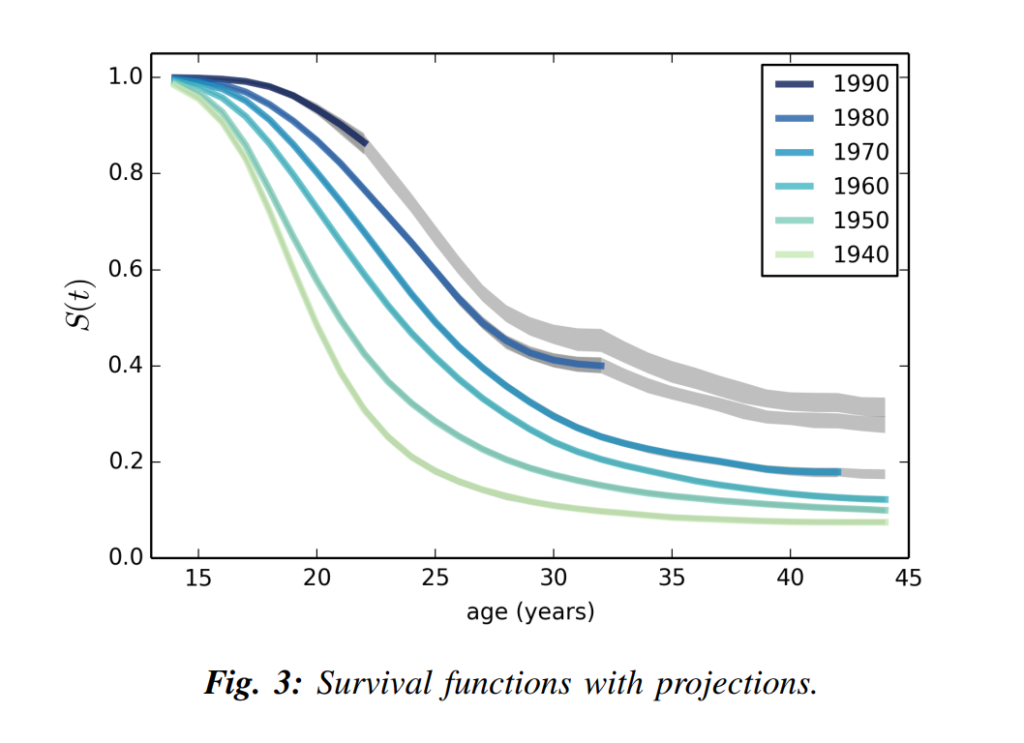
The vertical axis, S(t), is the estimated survival curve, which is the fraction of women who have never been married as a function of age. The gray lines show projections based on the assumption that each cohort going forward will “inherit” the hazard function of the previous cohort.
If you are not familiar with survival functions and hazard functions, you might want to read the SciPy paper, which explains the methodology.
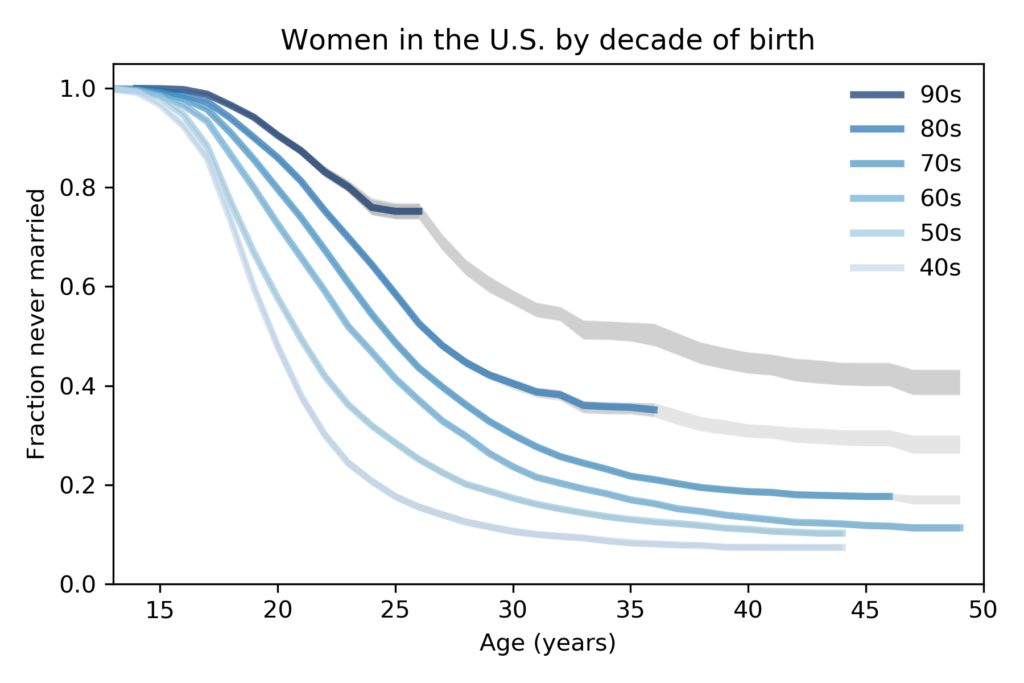
Now let’s see how things look with the new data. Here’s the updated plot:
A few things to notice:
Age at first marriage has been increasing for decades. Median age at first marriage has gone from 20 for women born in the 1940s to 27 for women born in the 1980s and looks likely to be higher for women born in the 1990s.
The fraction of women unmarried at age 44 has gone from 7% for women born in the 1940s to 18% for women born in the 1970s. And according to the projections I computed, this fraction will increase to 30% for women born in the 1980s and 42% for women born in the 1990s.
For women born the 1980s and 1990s, the survival curves have been surprisingly flat for the last five years; that is, very few women in these cohorts have been married during this time. This is the “marriage strike” I mentioned in the SciPy paper, and it seems to be ongoing.
Because the marriage strike is happening at the same time in two cohorts, it may be a period effect rather than a cohort effect; that is, it might be due to external factors affecting both cohorts, rather than a generational change. For example, economic conditions might be discouraging marriage.
If so, the marriage strike might end when external conditions change. But at least for now, it looks like people will continue getting married later, and substantially more people will remain unmarried in the future.
In my next post, I will show the results of this analysis for men.