Browsed by
Month: January 2021

The Retreat From Religion Continues

The Retreat From Religion Continues

A few years ago I wrote an article for the Scientific American blog where I used data from the General Social Survey (GSS) to describe changes in religious affiliation in the U.S.

And in this longer article I described changes in religious belief as well, including belief in God, interpretation of the Bible, and confidence in religious institutions.

Those articles were based on GSS data released in 2017, which included interviews up to 2016. Now the GSS has released additional data from interviews conducted in 2017 and 2018, including young adults born in 1999 and 2000.

So it’s time to update the results.

Religious affiliation by cohort

The following figure shows religious affiliation by year of birth.

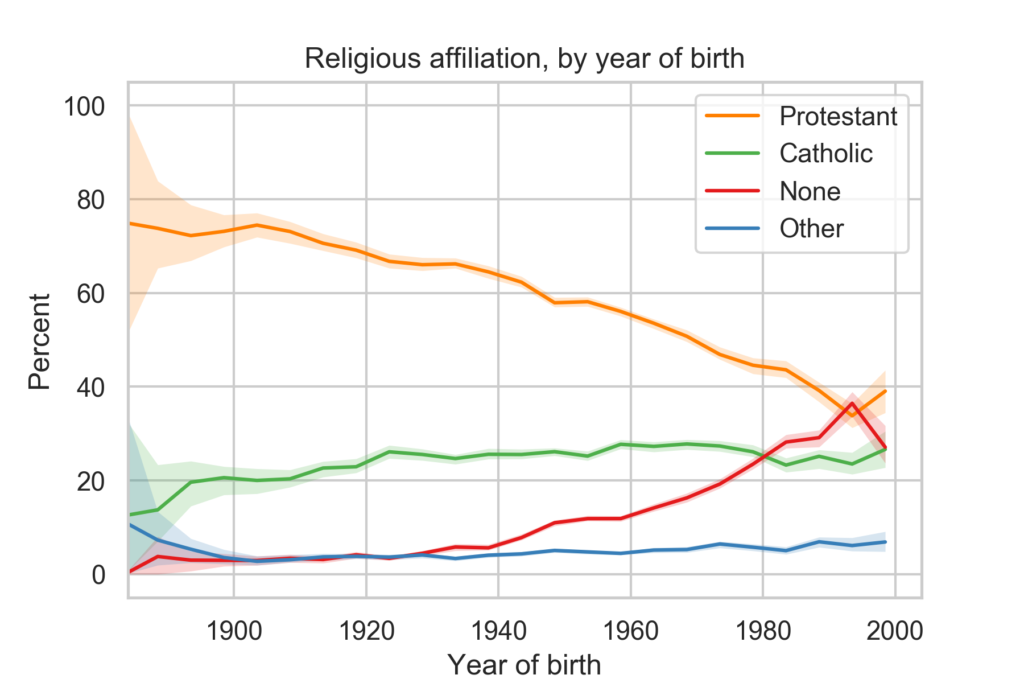
The youngest group in the survey, people born between 1996 and 2000, depart from several long-term trends:

  • They are more likely to identify as Protestant than the previous cohort, and slightly more likely to identify as Catholic.
  • And they are less likely to report no religious preference.

There are only 201 people in this group, so these results might be an anomaly. Data from other sources indicates that young adults are less religious than older groups.

Religious affiliation by year

The following figure shows religious affiliation by year of interview along with predictions based on a simple model of generational replacement.

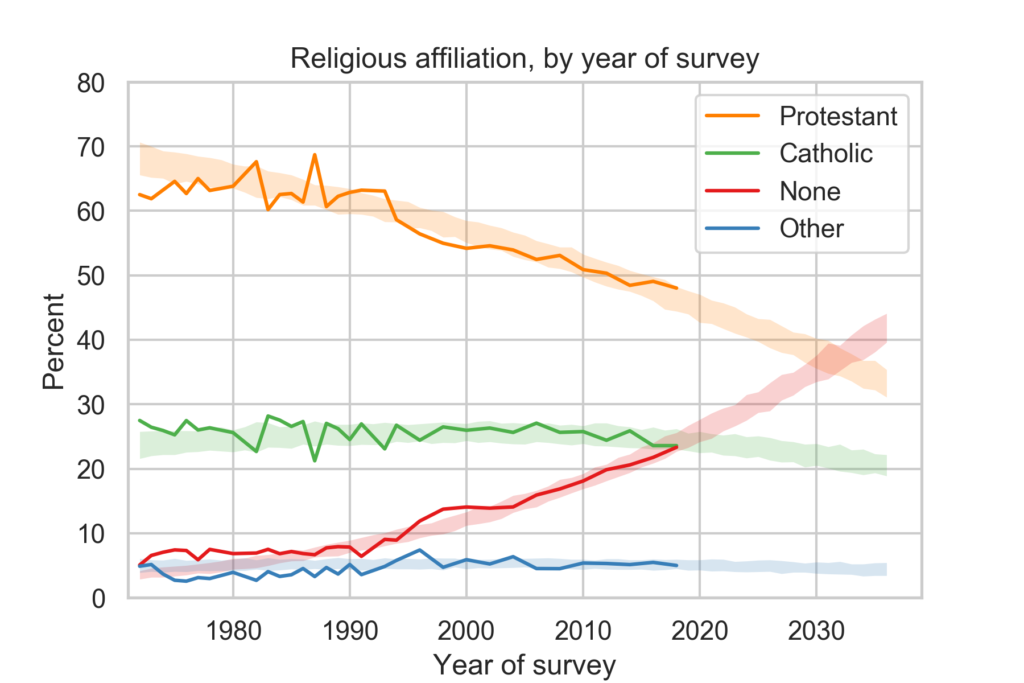
Despite the reversal of trends in the previous figure, the long-term trends in religious affiliation continue:

  • The fraction of people who identify as Protestant or Christian is declining and accelerating.
  • The fraction who identify as Catholic has started to decline.
  • The fraction with no religious affiliation is increasing and accelerating.

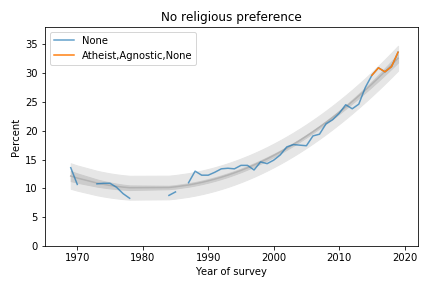
Based on the previous batch of data, I predicted that there would be more Nones than Catholics in 2020. With the most recent data, it looks like the cross-over might be ahead of schedule.

On these trends, there will be more Nones than Protestants sometime after 2030.

In the next article, I’ll present related trends in religious belief and confidence in religious institutions.

College Freshmen are More Godless Than Ever

College Freshmen are More Godless Than Ever

In the last 30 years, college students have become much less religious. The fraction who say they have no religious affiliation has more than tripled, from about 10% to 34%. And the fraction who say they have attended a religious service in the last year fell from more than 85% to 66%.

I’ve been following this trend for a while, using data from the CIRP Freshman Survey, which has surveyed a large sample of entering college students since 1966.

The most recently published data is from “95,505 first-time, full-time freshmen entering 148 baccalaureate institutions” in Fall 2019.

Of course, college students are not a representative sample of the U.S. population. Furthermore, as rates of college attendance have increased, they represent a different slice of the population over time. Nevertheless, surveying young adults over a long interval provides an early view of trends in the general population.

Religious preference

Among other questions, the Freshman Survey asks students to select their “current religious preference” from a list of seventeen common religions, “Other religion,” “Atheist”, “Agnostic”, or “None.”  

The options “Atheist” and “Agnostic” were added in 2015.  For consistency over time, I compare the “Nones” from previous years with the sum of “None”, “Atheist” and “Agnostic” since 2015.

The following figure shows the fraction of Nones from 1969, when the question was added, to 2019, the most recent data available.

Percentage of students with no religious preference from 1969 to 2019.

The blue line shows data until 2015; the orange line shows data from 2015 through 2019. The gray line shows a quadratic fit.  The light gray region shows a 95% predictive interval.

The quadratic model continues to fit the data well and the most recent data point is above the trend line, which suggests that the “rise of the Nones” is still accelerating.

Attendance

The survey also asks students how often they “attended a religious service” in the last year. The choices are “Frequently,” “Occasionally,” and “Not at all.” Respondents are instructed to select “Occasionally” if they attended one or more times, so a wedding or a funeral would do it.

The following figure shows the fraction of students who reported any religious attendance in the last year, starting in 1968. I discarded a data point from 1966 that seems unlikely to be correct.

Percentage of students who reported attending a religious service in the previous year.

About 66% of incoming college students said they attended a religious service in the last year, an all-time low in the history of the survey, and down more than 20 percentage points from the peak.

This curve is on trend, with no sign of slowing down.

Gender Gap

Female students are more religious than male students. The following graph shows the gender gap over time, that is, the difference in percentages of male and female students with no religious affiliation.

Difference in religious affiliation between male and female students.

The gender gap was growing until recently. It has shrunk in the last 3-4 years, but since it varies substantially from year to year, it is hard to rule out random variation.

Data Source

The American Freshman: National Norms Fall 2019
Stolzenberg, Aragon, Romo, Couch, McLennon, Eagan, and Kang,
Higher Education Research Institute, UCLA, June 2020

This and all previous reports are available from the HERI publications page.