A unique feature of the game is the dice, which yield three possible outcomes, 0, 1, or 2, with equal probability. When you add them up, you get some unusual probability distributions.
There are two phases of the game: During the first phase, players explore a haunted house, drawing cards and collecting items they will need during the second phase, called “The Haunt”, which is when the players battle monsters and (usually) each other.
So when does the haunt begin? It depends on the dice. Each time a player draws an “omen” card, they have to make a “haunt roll”: they roll six dice and add them up; if the total is less than the number of omen cards that have been drawn, the haunt begins.
For example, suppose four omen cards have been drawn. A player draws a fifth omen card and then rolls six dice. If the total is less than 5, the haunt begins. Otherwise the first phase continues.
Last time I played this game, I was thinking about the probabilities involved in this process. For example:
What is the probability of starting the haunt after the first omen card?
What is the probability of drawing at least 4 omen cards before the haunt?
What is the average number of omen cards before the haunt?
In 2015 I wrote a paper called “Will Millennials Ever Get Married?” where I used data from the National Survey of Family Growth (NSFG) to estimate the age at first marriage for women in the U.S, broken down by decade of birth.
I found that women born in the 1980s and 90s were getting married later than previous cohorts, and I generated projections that suggest they are on track to stay unmarried at substantially higher rates.
Here are the results from that paper, based on 58 488 women surveyed between 1983 to 2015:
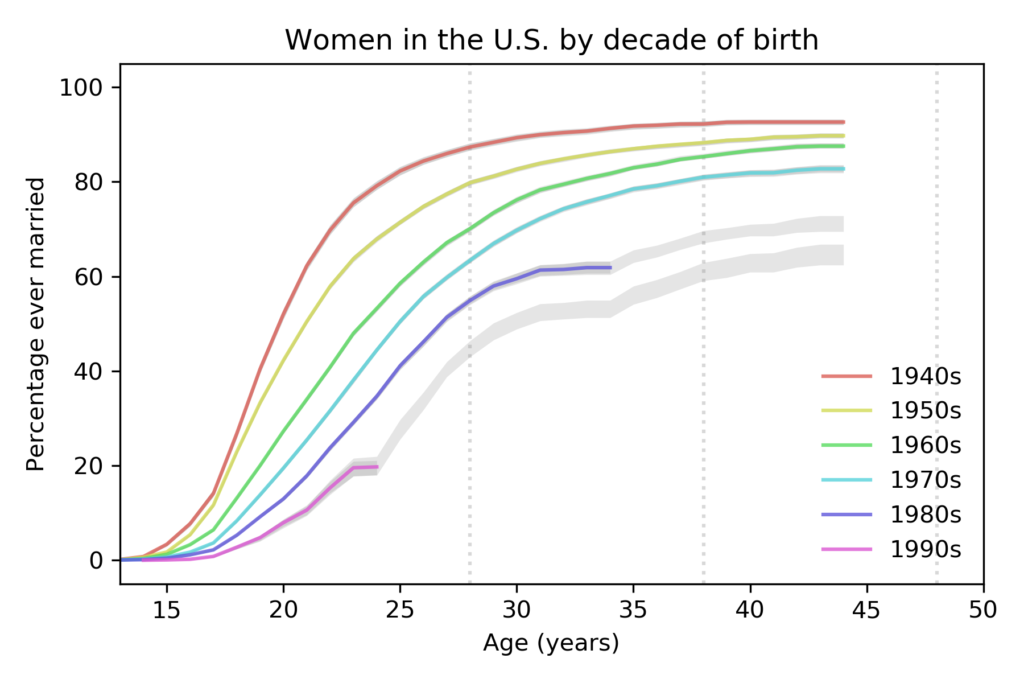
Percentage of women ever married, based on data up to 2015.
Each line represents a cohort grouped by decade of birth. For example, the top line represents women born in the 1940s.
The colored segments show the fraction of women who had ever been married as a function of age. For example, among women born in the 1940s, 82% had been married by age 25. Among women born in the 1980s, only 41% had been married by the same age.
The gray lines show projections I generated by assuming that going forward each cohort would be subject to the hazard function of the previous cohort. This method is likely to overestimate marriage rates.
These results show two trends:
Each cohort is getting married later than the previous cohort.
The fraction of women who never marry is increasing from one cohort to the next.
New data
Yesterday the National Center for Health Statistics (NCHS) released a new batch of data from surveys conducted in 2017-2019. So we can compare the predictions from 2015 with the new data, and generate updated predictions.
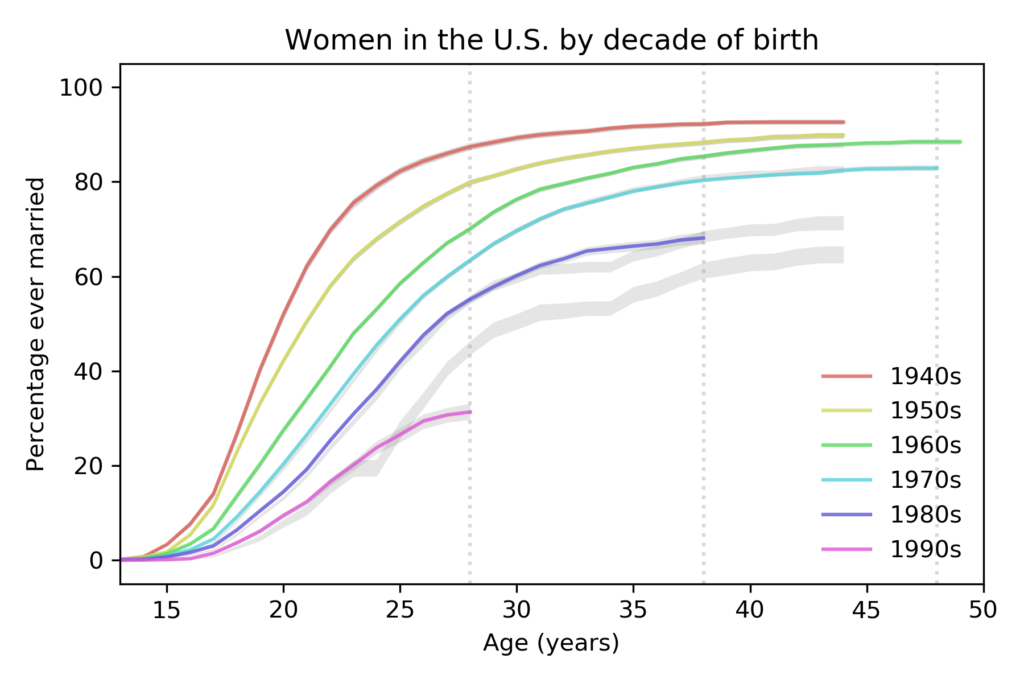
The following figure shows the predictions from the previous figure, which are based on data up to 2015, compared to the new curves based on data up to 2019, which includes 70 183 respondents.
Percentage of women ever married, based on data up to 2019, compared to predictions based on data up to 2015.
For women born in the 1980s, the fraction who have married is almost exactly as predicted. For women born in the 1990s, it is substantially lower.
New projections
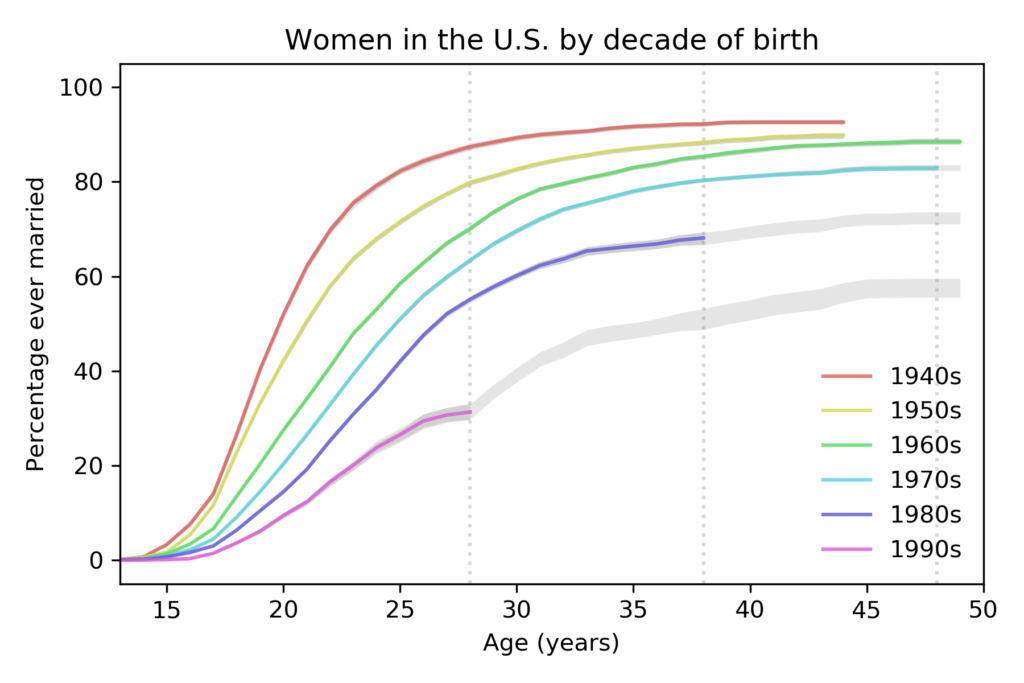
The following figure shows projections based on data up to 2019.
Percentage of women ever married, based on data up to 2019, with predictions based on data up to 2019.
The vertical dashed lines show the ages where we have the last reliable estimate for each cohort. The following table summarizes the results at age 28:
Decade of birth
1940s
1950s
1960s
1970s
1980s
1990s
% married before age 28
87%
80%
70%
63%
55%
31%
Percentage of women married by age 28, grouped by decade of birth.
The percentage of women married by age 28 has dropped quickly from each cohort to the next, by about 11 percentage points per decade.
The following table shows the same percentage at age 38; the last value, for women born in the 1990s, is a projection based on the data we have so far.
Decade of birth
1940s
1950s
1960s
1970s
1980s
1990s
% married before age 38
92%
88%
85%
80%
68%
51%
Percentage of women married by age 38, grouped by decade of birth.
Based on current trends, we expect barely half of women born in the 1990s to be married before age 38.
Finally, here are the percentages of women married by age 48; the last two values are projections.
Decade of birth
1940s
1950s
1960s
1970s
1980s
1990s
% married before age 48
>93%
>90%
88%
83%
72%
58%
Percentage of women married by age 48, grouped by decade of birth.
Based on current trends, we expect women born in the 1980s and 1990s to remain unmarried at rates substantially higher than previous generations.
Projections like these are based on the assumption that the future will be like the past, but of course, things change. In particular:
These data were collected before the COVID-19 pandemic. Marriage rates in 2020 will probably be lower than predicted, and the effect could continue into 2021 or beyond.
However, as economic conditions improve in the future, marriage rates might increase.
We’ll find out when we get the next batch of data in October 2022.
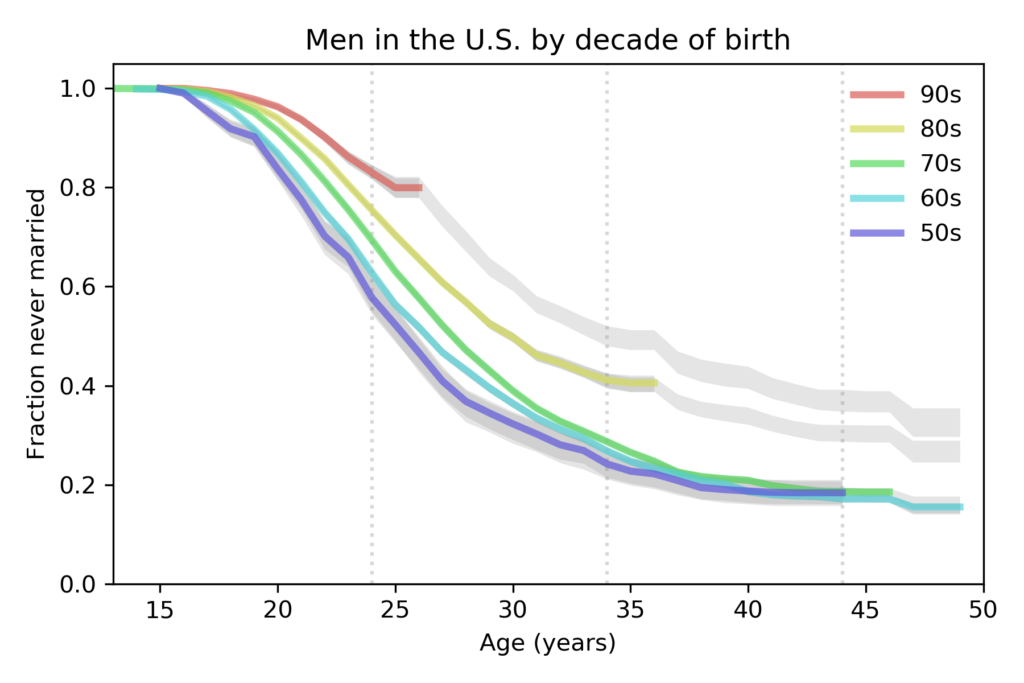
Again, I’m working with data from the National Survey of Family Growth, which surveyed 29,192 men in the U.S. between 2002 and 2017. I used Kaplan–Meier estimation to compute “survival” curves for the time until first marriage. The following figure shows the results for men grouped by decade of birth:
The colored lines show the estimated curves; the gray lines show projections based on moderate assumptions about future marriage rates. Two trends are apparent:
From one generation to the next, men have been getting married later. The median age at first marriage for men born in the 1950s was 26; for men born in the 1980s is it 30, and for men born in the 1990s, it is projected to be 35.
The fraction of men never married at age 44 was 18% for men born in the 1950s, 1960s, and 1970s. It is projected to increase to 30% for men born in the 1980s and 37% for men born in the 1990s.
Of course, thing could change in the future and make these projections wrong. But marriage rates in the last 5 years have been very low for both men and women. In order to catch up to previous generations, young men would have to start marrying at unprecedented rates, and they would have to start soon.