How Correlated Are You?
This post is an offshoot from Chapter 1 of Probably Overthinking It, which is available for pre-order now!
Suppose you measure the arm and leg lengths of 4082 people. You would expect those measurements to be correlated, and you would be right. In the ANSUR-II dataset, among male members of the armed forces, this correlation is about 0.75 — people with long arms tend to have long legs.
And how about arm length and chest circumference? You might expect those measurements to be correlated too, but not as strongly as arm and leg length, and you would be right again. The correlation is about 0.47.
So some pairs of measurements are more correlated than others. There are a total of 93 measurements in the ANSUR-II dataset, which means there are 93 * 92 = 8556 correlations between pairs of measurements. So here’s a question that caught my attention: Are there measurements that are uncorrelated (or only weakly correlated) with the others?
To answer that, I computed the average magnitude (positive or negative) of the correlation between each measurement and the other 92. The most correlated measurement is weight, with an average of 0.56. So if you have to choose one measurement, weight seems to provide the most information about all of the others.
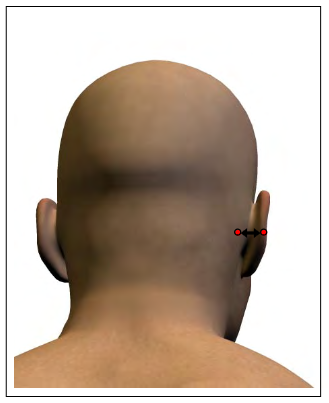
The least correlated measurement turns out to be ear protrusion — its average correlation with the other measurements is only 0.03, which is not just small, it is substantially smaller than the next smallest, which is ear breadth, with an average correlation of 0.13.
So it seems like there is something special about ears.
Beyond the averages
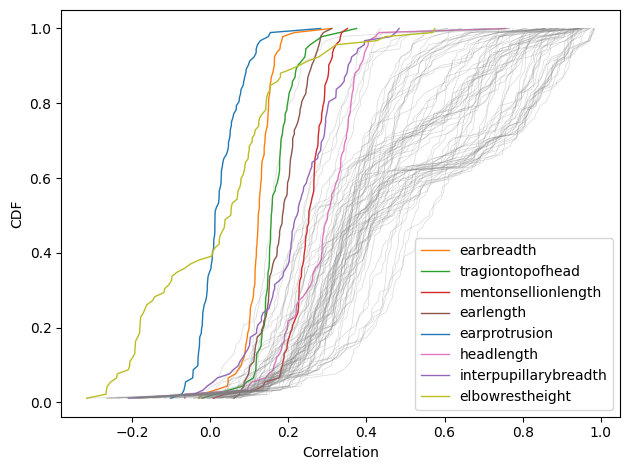
We can get a better sense of what’s going on by looking at the distribution of correlations for each measurement, rather than just the averages. I’ll use my two favorite data visualization tools: CDFs, which make it easy to identify outliers, and spaghetti plots, which make it easy to spot oddities.
This figure shows the CDF of correlations for each of the 93 measurements.
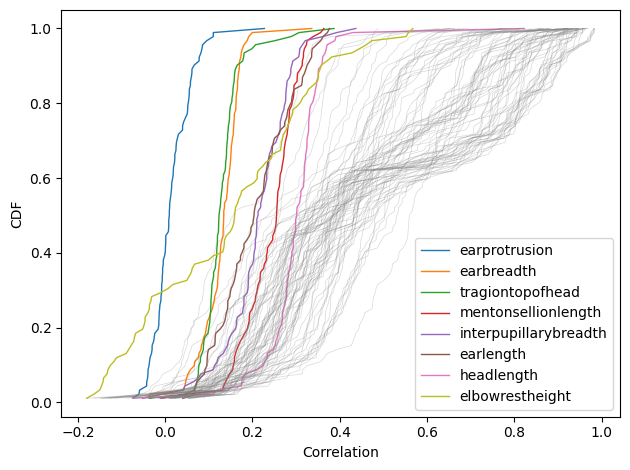
Here are the conclusions I draw from this figure:
Correlations are almost all positive
Almost all of the correlations are positive, we we’d expect. The exception is elbow rest height, which is negatively correlated with almost half of the other measurements. This oddity is explainable if we consider how the measurement is defined:
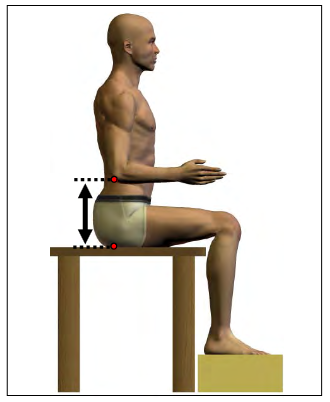
All of the other measurements are based on the distance between two parts of the body; in contrast, elbow rest height is the distance from the elbow to the chair. It is negatively correlated with other measurements because it measures a negative space — in effect, it is the difference between two other measurements: torso length and upper arm length.
Many distributions are multimodal
Overall, most correlations are moderate, between 0.2 and 0.6, but there are a few clusters of higher correlations, between 0.6 and 1.0. Some of these high correlations are spurious because they represent multiple measurements of the same thing — for example when one measurement is the sum of another two, or nearly so.
A few distributions have low variance
The distributions I’ve colored and labeled have substantially lower variance than the others, which means that they are about equally correlated with all other measurements. Notably, all of them are located on the head. It seems that the dimensions of the head are weakly correlated with the dimensions of the rest of the body, and that correlation is remarkably consistent.
And finally…
Ear protrusion isn’t correlated with anything
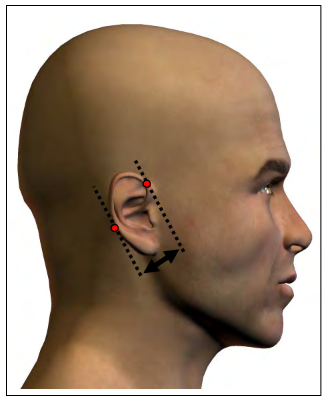
Among the unusual measurements with low variance, ear protrusion is doubly unusual because its correlations are so consistently weak. The exceptions are ear length (0.22) and ear breadth (0.08) — which make sense — and posterior crotch length (0.11), shown here:
The others are small enough to be plausibly due to chance.
I have a conjecture about why: ear protrusion might depend on details of how the ear develops, which might depend on idiosyncratic details of the developmental environment, with little or no genetic contribution. In that sense, ear protrusion might be like fingerprints.
All of these patterns are the same for women
Here’s the same figure for the 1986 female ANSUR-II participants:
The results are qualitatively the same. The variance in correlation with ear protrusion is higher, but that is consistent with random chance and a smaller sample size.
In conclusion, when we look at correlations among human measurements, the head is different from the rest of the body, the ear is different from the head, and ear protrusion is uniquely uncorrelated with anything else.