Life in a Lognormal World
At PyData Global 2023 I will present a talk, “Extremes, outliers, and GOATs: On life in a lognormal world”. It is scheduled for Wednesday 6 December at 11 am Eastern Time.
[UPDATE: here is the video]
Here is the abstract:
The fastest runners are much faster than we expect from a Gaussian distribution, and the best chess players are much better. In almost every field of human endeavor, there are outliers who stand out even among the most talented people in the world. Where do they come from?
In this talk, I present as possible explanations two data-generating processes that yield lognormal distributions, and show that these models describe many real-world scenarios in natural and social sciences, engineering, and business. And I suggest methods — using SciPy tools — for identifying these distributions, estimating their parameters, and generating predictions.
You can buy tickets for the virtual conference here. If your budget for conferences is limited, PyData tickets are sold under a pay-what-you-can pricing model, with suggested donations based on your role and location.
My talk is based partly on Chapter 4 of Probably Overthinking It and partly on an additional exploration that didn’t make it into the book.
The exploration is motivated by this paper by Philip Gingerich, which takes the heterodox view that measurements in many biological systems follow a lognormal model rather than a Gaussian. Looking at anthropometric data, Gingerich reports that the two models are equally good for 21 of 28 measurements, “but whenever alternatives are distinguishable, [the lognormal model] is consistently and strongly favored.”
I replicated his analysis with two other datasets:
- The Anthropometric Survey of US Army Personnel (ANSUR II), available from the Open Design Lab at Penn State.
- Results of medical blood tests from supplemental material from “Quantitative laboratory results: normal or lognormal distribution?” by Frank Klawonn , Georg Hoffmann and Matthias Orth.
I used different methods to fit the models and compare them. The details are in this Jupyter notebook.
The ANSUR dataset contains 93 measurements from 4,082 male and 1,986 female members of the U.S. armed forces. For each measurement, I found the Gaussian and lognormal models that best fit the data and computed the mean absolute error (MAE) of the models.
The following scatter plot shows one point for each measurement, with the average error of the Gaussian model on the x-axis and the average error of the lognormal model on the y-axis.
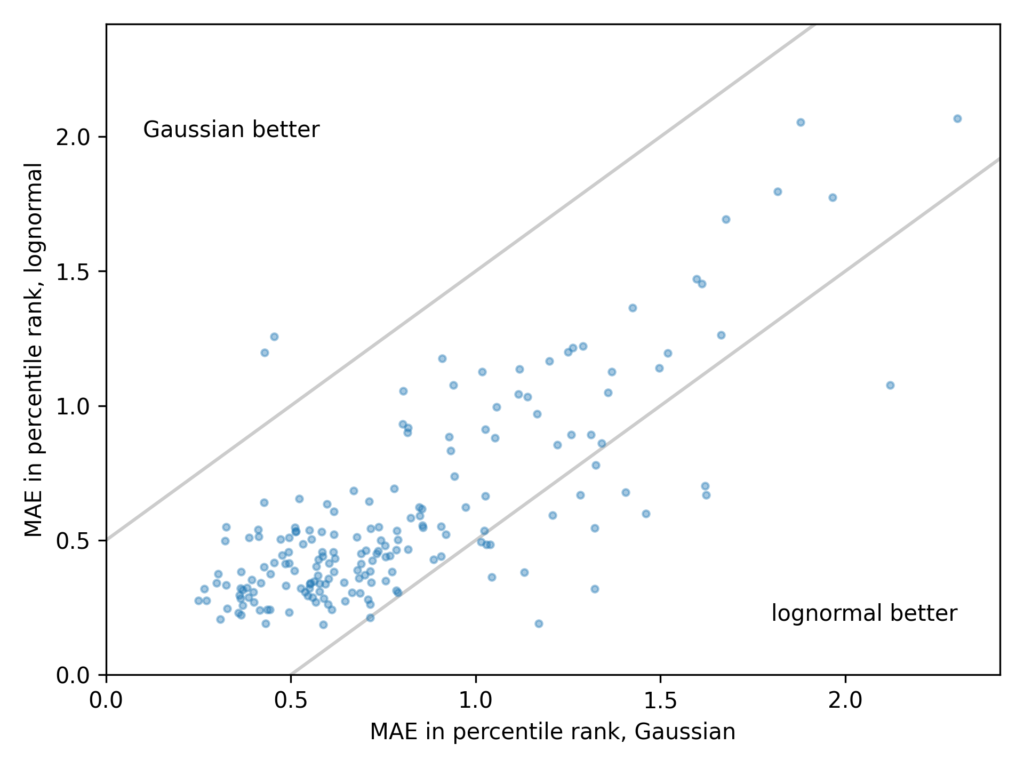
- Points in the lower left indicate that both models are good.
- Points in the upper right indicate that both models are bad.
- In the upper left, the Gaussian model is better.
- In the lower right, the lognormal model is better.
These results are consistent with Gingerich’s. For many measurements, the Gaussian and lognormal models are equally good, and for a few they are equally bad. But when one model is better than the other, it is almost always the lognormal.
The most notable example is weight:
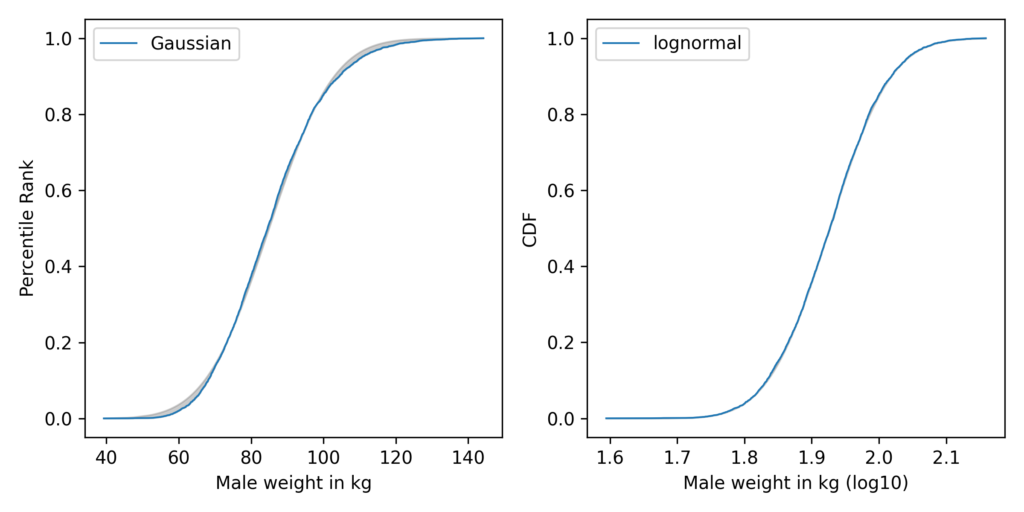
In these figures, the grey area shows the difference between the data and the best-fitting model. On the left, the Gaussian model does not fit the data very well; on the right, the lognormal model fits so well, the gray area is barely visible.
So why should measurements like these follow a lognormal distribution? For that you’ll have to come to my talk.
In the meantime, Probably Overthinking It is available to predorder now. You can get a 30% discount if you order from the publisher and use the code UCPNEW. You can also order from Amazon or, if you want to support independent bookstores, from Bookshop.org.