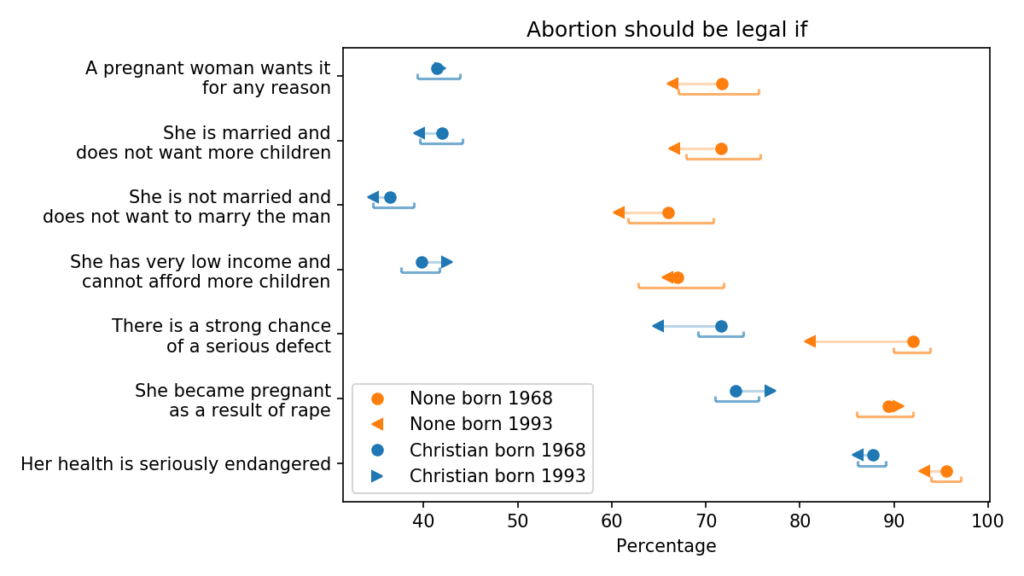
GSS respondents were asked, “Please tell me whether or not you think it should be possible for a pregnant woman to obtain a legal abortion” under different circumstances.
The following figure shows the results.
Generational changes in beliefs about legal abortion
The blue markers are for people whose religious preference is Catholic, Protestant, or Christian; the orange markers are for people with no religious affiliation.
For each group, the circles show estimated percentages for people born in 1968; the arrowheads show percentages for people born in 1993.
For both groups, the estimates are for 2018, when the younger group was 25 and the older group was 50. The brackets show 90% confidence intervals.
Before we look for generational changes, we should notice the starting point: a large majority of Americans support legal abortion, at least in some circumstances.
In cases of severe birth defects and pregnancy due to rape, the majority is about 70% of Christians and 90% of the nonreligious.
In cases of serious danger to the woman’s health, it’s almost 90% of Christians and nearly all of the nonreligious.
Under other circumstances, opinions are more divided, with support near 40% among Christians and 70% among the Nones.
Looking now at the generational changes, I see only one that is likely to be practically and statistically significant: younger people in both groups are less likely than the previous generation to support legal abortion if there is a chance of serious birth defect.
Even so, there is majority support in both groups, more than 60% among Christians and 80% among Nones at age 25.
In summary:
Beliefs about abortion depend substantially on the circumstances;
In many circumstances, a large majority of Christians and the non-religious support legal abortion;
Even where there is disagreement between the groups, there is substantial diversity of opinion within both groups;
Generational changes in these opinions are generally small and within the statistical margin of error.
This topic is part of my book in progress, You Would Choose Now, which uses decades of survey data to track changing attitudes in the United States. The early access edition is available now.
Generational changes in religious belief and public policy
Here are results for five propositions with relatively high support:
Generational changes in support for issues related to law and public policy
The blue markers are for people whose religious preference is Catholic, Protestant, or Christian; the orange markers are for people with no religious affiliation.
For each group, the circles show estimated percentages for people born in 1968; the arrowheads show percentages for people born in 1993.
For both groups, the estimates are for 2018, when the younger group was 25 and the older group was 50. The brackets show 90% confidence intervals.
The first row shows the percentage of respondents who answered “Yes” to the question “Do you think the use of marijuana should be made legal or not?”
Young Christians are substantially more likely to support legalization than their parents’ generation. Among the Nones, support might also be increasing, but the change is within the statistical margin of error.
Young Christians also support legal pornography. When asked, “Which of these statements comes closest to your feelings about pornography laws?”, more than 75% of them indicated that it should be legal, or legal for adults, rather than illegal. That’s more than 10 percentage points higher than in the previous generation.
Support for legal pornography has also increase among the unaffiliated, from 85% to almost 90%.
Young Christians are more likely to support legal euthanasia; when asked “When a person has a disease that cannot be cured, do you think Doctors should be allowed by law to end the patient’s life by some painless means if the patient and his family request it?”, more than 75% say “Yes”.
On these three questions, Christians are moving toward the position of their secular peers. On the other two questions, there are no clear patterns:
Support for fair housing policy is high in both groups and might be increasing.
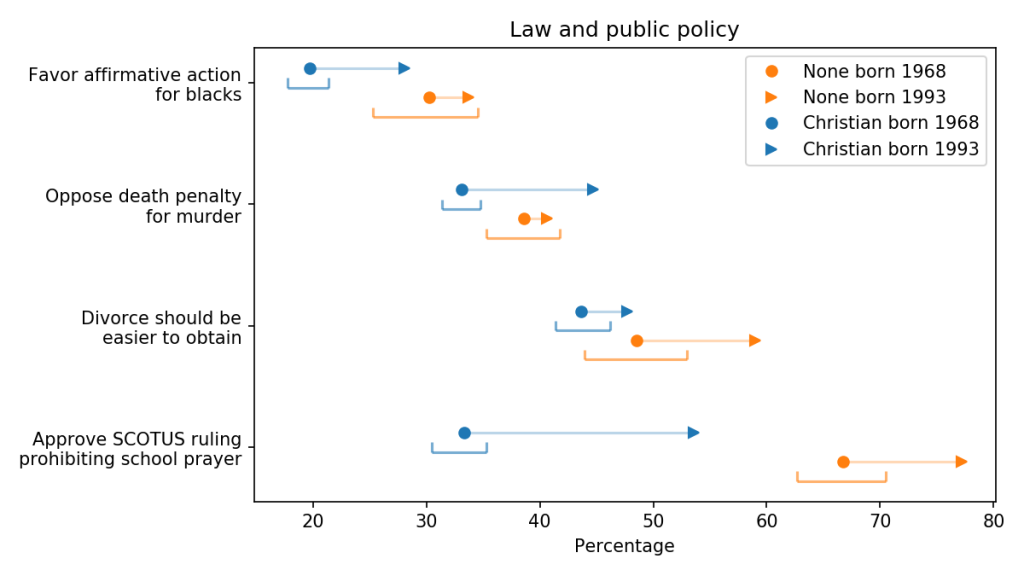
Here are results for four propositions with somewhat lower support:
Generational changes in support for issues related to law and public policy
These results shows that younger Christians are more likely than the previous generation to:
Support affirmative action,
Oppose legal obstactles to divorce,
Oppose the death penalty, and
Approve the prohibition of prayer in public schools.
In each case, Christians are moving toward the position held by the nonreligious, and in one case they have overtaken them: Christians are now more likely to oppose the death penalty than Nones of the current or previous generation.
Regarding school prayer, they were asked “The United States Supreme Court has ruled that no state or local government may require the reading of the Lord’s Prayer or Bible verses in public schools. What are your views on this–do you approve or disapprove of the court ruling?” More than 50% of young Christians answered that they approve, 20 percentage points higher than the previous generation.
Summary
These results suggest that people who identify as Christians are more politically progressive than previous generations. On most issues of law and public policy, a 25-year old Christian is more aligned with a 50-year old None than a 50-year old Christian.
In the next article, I’ll explore generational changes in other opinions and attitudes.
Related reading: In this article about an evangelical Christian activist, The Washington Post Magazine asks “Can Shane Claiborne’s progressive version of evangelical Christianity catch on with a new generation?” The article emphasizes Claiborne’s progressive views on reducing gun violence. My analysis of data from the GSS suggests that young Christians are more progressive than previous generations on many issues, but gun control is not one of them.
This topic is part of my book in progress, You Would Choose Now, which uses decades of survey data to track changing attitudes in the United States. The early access edition is available now.
Young Christians are less religious than the previous generation
This is the first in a series of articles where I use data from the General Social Survey (GSS) to explore
Differences in beliefs and attitudes between Christians and people with no religious affiliation (“Nones”),
Generational differences between younger and older Christians, and
Generational differences between younger and older Nones.
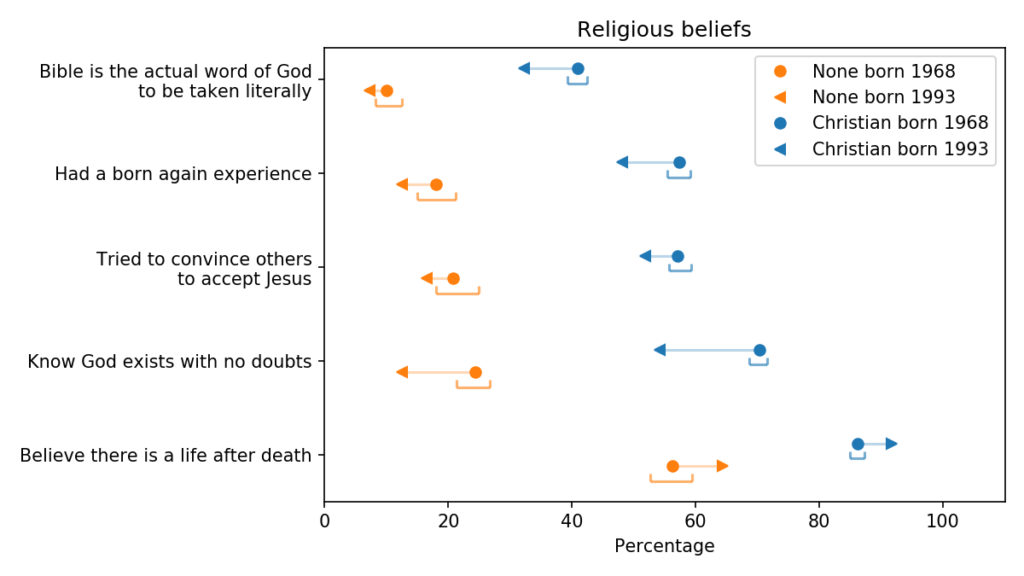
On several dimensions of religious belief, young Christians are less religious than their parents’ generation. I’ll explain the methodology below, but here are the results:
Generational changes in religious belief, comparing people born in 1968 and 1993
The blue markers are for Christians (people whose religious preference is Catholic, Protestant, or Christian); the orange markers are for people with no religious affiliation.
For each group, the circles show estimated percentages for people born in 1968; the arrowheads show percentages for people born in 1993.
For both groups, the estimates are for 2018, when the younger group was 25 and the older group was 50. The brackets show 90% confidence intervals for the estimates, computed by random resampling.
The top row shows the fraction of respondents who interpret the Christian bible literally; more specifically, when asked “Which of these statements comes closest to describing your feelings about the Bible?”, they chose the first of these options:
“The Bible is the actual word of God and is to be taken literally, word for word”
“The Bible is the inspired word of God but not everything in it should be taken literally, word for word.
“The Bible is an ancient book of fables, legends, history, and moral precepts recorded by men.”
Not surprisingly, people who consider themselves Christian are more likely to interpret the Bible literally, compared to people with no religious affiliation.
But younger Christians are less likely to be literalists than the previous generation. Most of the other variables show the same pattern; younger Christians are less likely to answer yes to these questions:
“Would you say you have been ‘born again’ or have had a ‘born again’ experience — that is, a turning point in your life when you committed yourself to Christ?”
“Have you ever tried to encourage someone to believe in Jesus Christ or to accept Jesus Christ as his or her savior?”
And they are less likely to report that they know God really exists; specifically, they were asked “Which statement comes closest to expressing what you believe about God?” and given these options:
I don’t believe in God
I don’t know whether there is a God and I don’t believe there is any way to find out.
I don’t believe in a personal God, but I do believe in a Higher Power of some kind.
I find myself believing in God some of the time, but not at others.
While I have doubts, I feel that I do believe in God.
I know God really exists and I have no doubts about it.
Younger Christians are less likely to say they know God exists and have no doubts.
Despite all that, younger Christians are more likely to believe in an afterlife. When asked “Do you believe there is a life after death?”, more than 90% say yes.
Among the unaffiliated, the trends are the same. Younger Nones are less likely to believe that the Bible is the literal word of God, less likely to have proselytized or been born again, and less likely to be sure God exists. But they are a little more likely to believe in an afterlife.
More questions, less religion
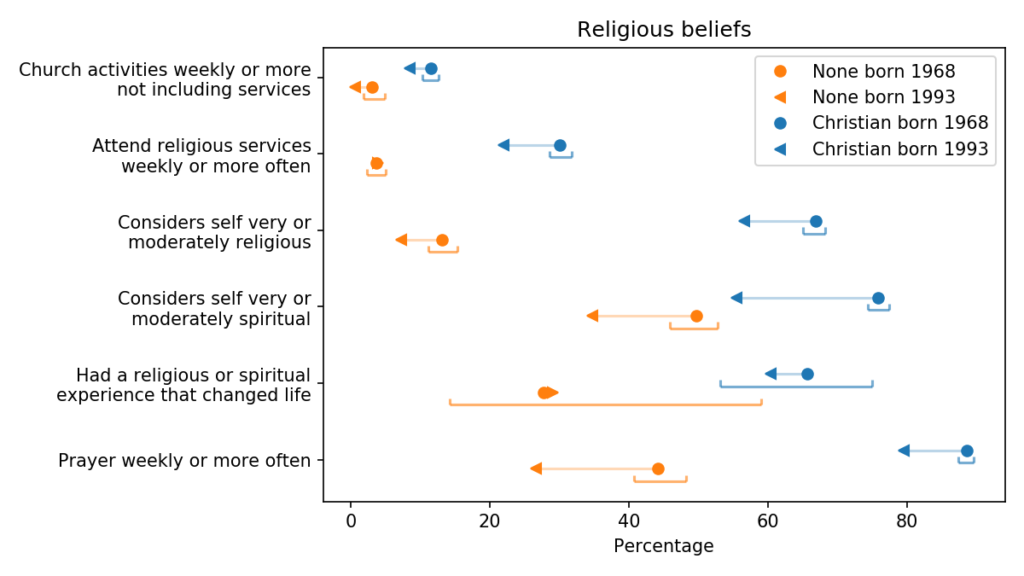
UPDATE: Since the first version of this article, I’ve had a chance to look at six other questions related to religious belief and activity. Here are the results:
Generational changes in religious belief, comparing people born in 1968 and 1993
Qualitatively, these results are similar to what we saw before: controlling for period effects, younger Christians are more secular than the previous generation, in both beliefs and actions.
They are substantially less likely to consider themselves “religious” or “spiritual”, and less likely to attend religious services or pray weekly. And they are slightly less likely to participate in church activities other than services.
They might also be less likely to say they have had a life-changing religious experience, but that change falls within the margin of error.
In later articles, I’ll look at trends in other beliefs and attitudes, especially related to public policy. But first I should explain how I generated these estimates.
Methodology
My goal is to estimate generational changes, that is, cohort effects as distinguished from age and period effects. In general, it is not possible to distinguish between age, period, and cohort effects without making some assumptions. So this analysis is based on the assumption that age effects in this dataset are negligible compared to period and cohort effects.
Data from the General Social Survey goes back to 1972; it includes data from almost 65,000 respondents.
To measure current differences between people born in 1968 and 1993, I could select only respondents born in those years and interviewed in 2018. But there are not very many of them.
Alternatively, I could use data from all respondents, going back to 1972, fit a model, and use the model to estimate generational differences. That might work, but it would probably give too much weight to older, less relevant data.
As a compromise, I use data from 1998 to 2018, from respondents born in 1940 or later. This subset includes about 25,000 respondents. But not every respondent was asked every question, so the number of valid responses for most questions is smaller.
For most questions, I discard a small number of respondents who gave no response or said they did not know.
To model the responses, I use logistic regression with year of birth (cohort) and year of interview as independent variables. For questions with more than two responses, I choose one of the responses to study, usually the most popular; in a few cases, I grouped a subset of responses (for example “agree” and “strongly agree”).
I use a quadratic model for the period effect and a cubic model of the cohort effect, using visual tests to check whether the models do an acceptable job of describing the trends in the data.
I fit separate models for Christians and Nones, to allow for the possibility that trends might look different in the two groups (as it turns out they often do).
Then I use the models to generate predictions for four groups: Christians born in 1968 and 1993, and Nones born in the same years. These are “predictions” in the statistical sense of the word, but they are deliberately not extrapolations into cohorts or periods that are not in the dataset; it might be more correct to call them “interpolations”.
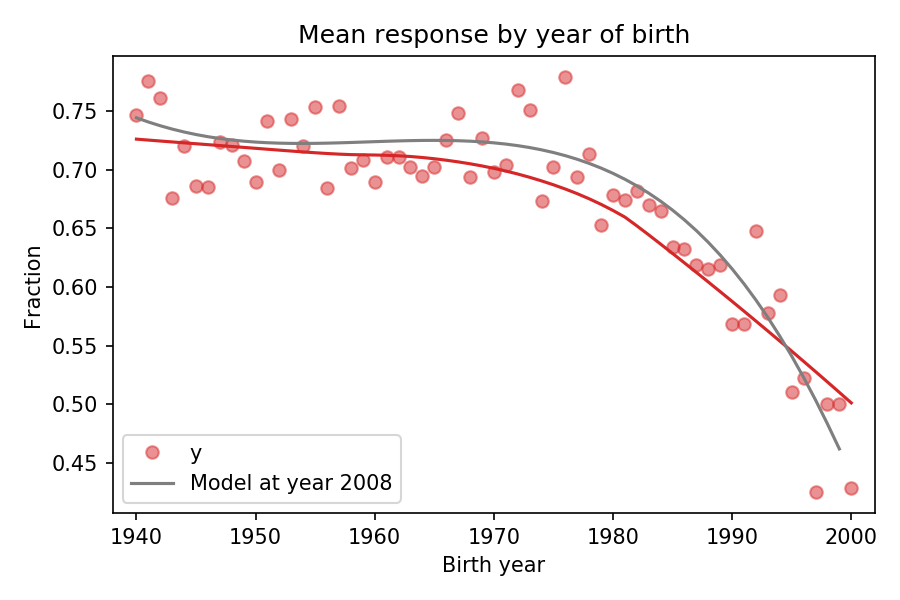
To show how this method works, let’s consider the fraction of Christians who answer that they know God exists, with no doubts. The following figure shows this fraction as a function of birth year (cohort):
Fraction of Christians who says they know God exists, plotted over year of birth
The red dots show the fraction of respondents in each birth cohort. The red line shows a smooth curve through the data, computed by local regression (LOWESS). The gray line shows the predictions of the model for year 2008.
This figure shows that the logistic regression model of birth year does an acceptable job of describing the trends in the data, while also controlling for year of interview.
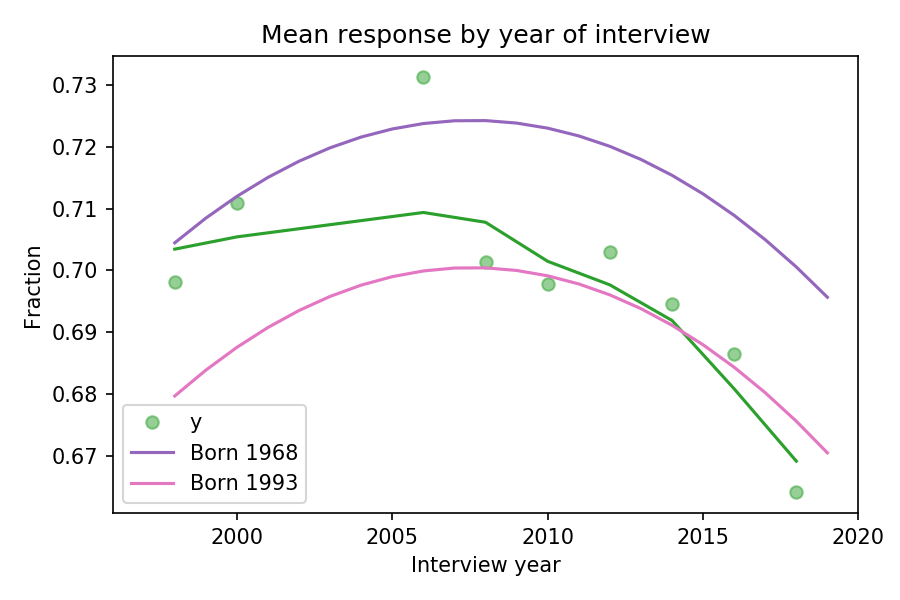
To see whether the model also describes trends over time, we can plot the fraction of respondents in each year of interview:
Fraction of Christians who says they know God exists, plotted over year of inteview
The green dots show the fraction of respondents during each year of interview and the green line shows a local regression through the data. The purple line shows the model’s predictions for someone born in 1968; the pink line shows predictions for someone born in 1993.
The gap between the purple and pink curves is the estimated generational change; in this example, it’s about 3 percentage points.
In summary, the model uses data from a range of birth years and interview years to fit a model, then uses the model to estimate the difference in response between people born in different years, both interviewed in 2018.
The results are based on the assumption that the model adequately describes the period and cohort effects, and that any age effects are negligible by comparison.
This topic is part of my book in progress, You Would Choose Now, which uses decades of survey data to track changing attitudes in the United States. The early access edition is available now.