Attention, Chinese Readers
The Chinese edition of Probably Overthinking It is available now (also here)!

If you have the Chinese edition, there are two sections you won’t get to read — so I am including them here.
Here is an excerpt from Chapter 3, including the deleted paragraph:
In the Present
The women surveyed in 1990 rejected the childbearing example of their mothers emphatically. On average, each woman had 2.3 fewer children than her mother. If that pattern had continued for another generation, the average family size in 2018 would have been about 0.8. But it wasn’t.
In fact, the average family size in 2018 was very close to 2, just as in 1990. So how did that happen?
As it turns out, this is close to what we would expect if every woman had one child fewer than her mother. The following distribution shows the actual distribution in 2018, compared to the result if we start with the 1990 distribution and simulate the “one child fewer” scenario.
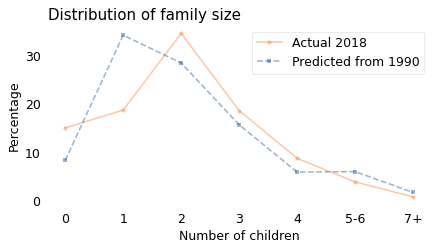
The means of the two distributions are almost the same, but the shapes are different. In reality, there were more zero- and two-child families in 1990 than the simulation predicts, and fewer one-child families. But at least on average, it seems like women in the U.S. have been following the “one child fewer” policy for the last 30 years.
The scenario at the beginning of this chapter is meant to be light-hearted, but in reality governments in many places and times have enacted policies meant to control family sizes and population growth. Most famously, China implemented a one-child policy in 1980 that imposed severe penalties on families with more than one child. Of course, this policy is objectionable to anyone who considers reproductive freedom a fundamental human right. But even as a practical matter, the unintended consequences were profound.
Rather than catalog them, I will mention one that is particularly ironic: while this policy was in effect, economic and social forces reduced the average desired family size so much that, when the policy was relaxed in 2015 and again in 2021, average lifetime fertility increased to only 1.3, far below the level needed to keep the population constant, near 2.1. Since then, China has implemented new policies intended to increase family sizes, but it is not clear whether they will have much effect. Demographers predict that by the time you read this, the population of China will probably be shrinking [UPDATE: It is.]. The consequences of the one-child policy are widespread and will affect China and the rest of the world for a long time.
And here is an excerpt from Chapter 5, including the deleted explanation.
Child mortality
Fortunately, child mortality has decreased since 1900. The following figure shows the percentage of children who die before age 5 for four geographical regions, from 1900 to 2019. These data were combined from several sources by Gapminder, a foundation based in Sweden that “promotes sustainable global development […] by increased use and understanding of statistics.”
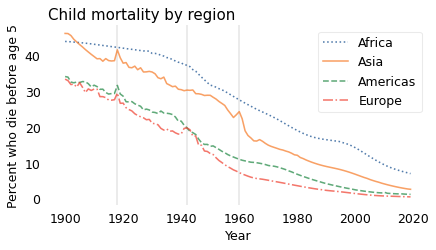
In every region, child mortality has decreased consistently and substantially. The only exceptions are indicated by the vertical lines: the 1918 influenza pandemic, which visibly affected Asia, the Americas, and Europe; World War II in Europe (1939-1945); and the Great Leap Forward in China (1958-1962). In every case, these exceptions did not affect the long-term trend.
[COMMENT: I thought I was being diplomatic by referring generally to the Great Leap Forward — rather than the Great Chinese Famine or “Three Years of Great Famine” (三年大饥荒) — but apparently that was not enough.]
Although there is more work to do, especially in Africa, child mortality is substantially lower now, in every region of the world, than in 1900. As a result most people now are better new than used.
To demonstrate this change, I collected recent mortality data from the Global Health Observatory of the World Health Organization (WHO). For people born in 2019, we don’t know what their future lifetimes will be, but we can estimate it if we assume that the mortality rate in each age group will not change over their lifetimes.
Based on that simplification, the following figure shows average remaining lifetime as a function of age for Sweden and Nigeria in 2019, compared to Sweden in 1905.
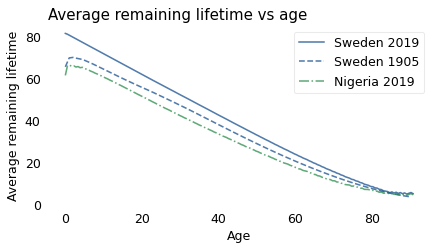
Since 1905, Sweden has continued to make progress; life expectancy at every age is higher in 2019 than in 1905. And Swedes now have the new-better-than-used property. Their life expectancy at birth is about 82 years, and it declines consistently over their lives, just like a light bulb.
Unfortunately, Nigeria has one of the highest rates of child mortality in the world: in 2019, almost 8% of babies died in their first year of life. After that, they are briefly better used than new: life expectancy at birth is about 62 years; however, a baby who survives the first year will live another 65 years, on average.
Going forward, I hope we continue to reduce child mortality in every region; if we do, soon every person born will be better new than used. Or maybe we can do even better than that.