Local regression in Python
I love data visualization make-overs (like this one I wrote a few months ago), but sometimes the tone can be too negative (like this one I wrote a few months ago).
Sarah Leo, a data journalist at The Economist, has found the perfect solution: re-making your own visualizations. Here’s her tweet.
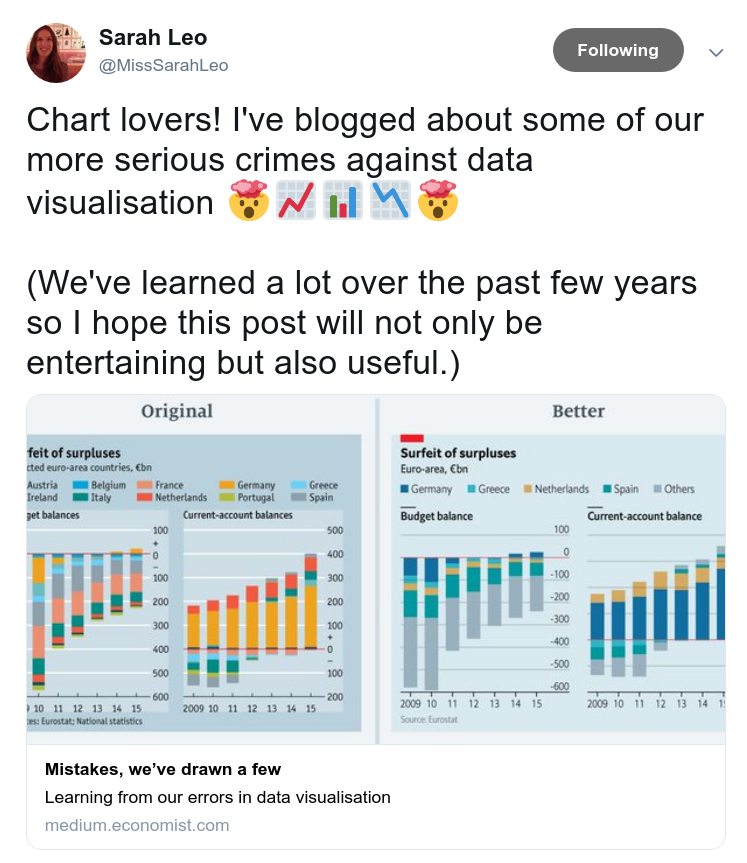
And here’s the link to the article, which you should go read before you come back here.
One of her examples is the noisy line plot on the left, which shows polling results over time.
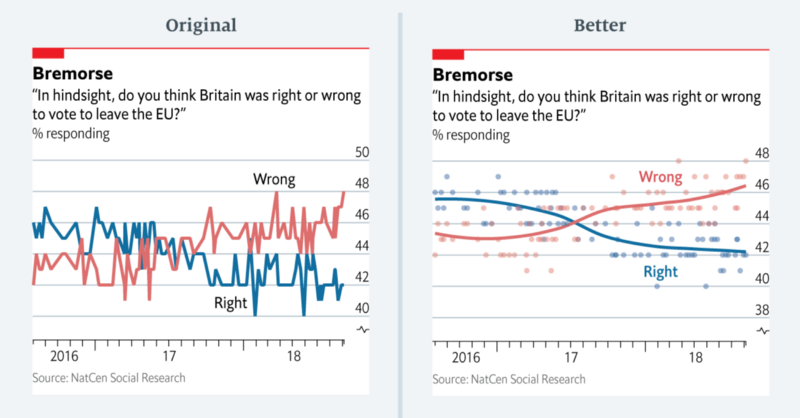
Here’s Leo’s explanation of what’s wrong and why:
Instead of plotting the individual polls with a smoothed curve to show the trend, we connected the actual values of each individual poll. This happened, primarily, because our in-house charting tool does not plot smoothed lines. Until fairly recently, we were less comfortable with statistical software (like R) that allows more sophisticated visualisations. Today, all of us are able to plot a polling chart like the redesigned one above.
This confession made me realize that I am in the same boat they were in: I know about local regression, but I don’t use it because I haven’t bothered to learn the tools.
Fortunately, filling this gap in my toolkit took less than an hour. The StatsModels library provides lowess, which computes locally weighted scatterplot smoothing.
I grabbed the data from The Economist and read it into a Pandas DataFrame. Then I wrote the following function, which takes a Pandas Series, computes a LOWESS, and returns a Pandas Series with the results:
from statsmodels.nonparametric.smoothers_lowess import lowess

def make_lowess(series):
    endog = series.values
    exog = series.index.values

    smooth = lowess(endog, exog)
    index, data = np.transpose(smooth)

    return pd.Series(data, index=pd.to_datetime(index))
And here’s what the results look like:
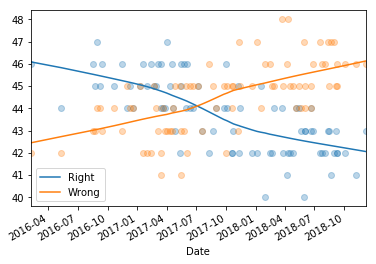
The smoothed lines I got look a little different from the ones in The Economist article. In general the results depends on the parameters we give LOWESS. You can see all the details in this Jupyter notebook.
Thanks to Sarah Leo for inspiring me to learn to use LOWESS, and for providing the data I used to replicate the results.