A recent paper in the New England Journal of Medicine, Attention Deficit–Hyperactivity Disorder and Month of School Enrollment, compares diagnosis rates for ADHD for children born in August and children born in September. In states that have a September 1 cutoff for children to start school, students born in September are generally the oldest in their class, and children born in August the youngest.
And it turns out that children born in August are about 30% more likely to be diagnosed with ADHD, plausibly due to age-related differences in behavior.
The analysis in the paper uses null-hypothesis significance tests (NHST) and focuses on the difference between August and September births. But if it is true that the difference in diagnosis rates is due to age differences, we should expect to see a “dose-response” curve with gradually increasing rates from September to August.
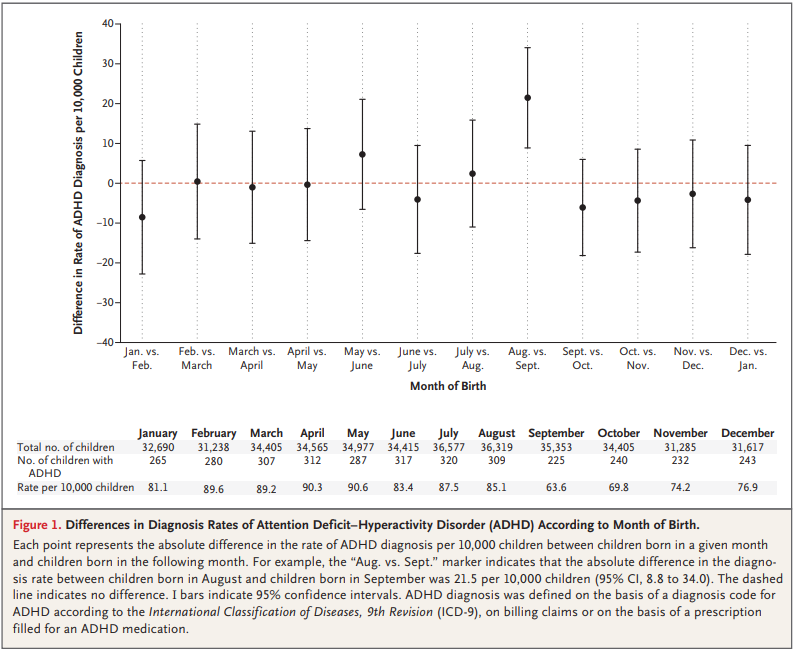
Fortunately, the article includes enough data for me to replicate and extend the analysis. Here is the figure from the paper showing the month-to-month comparisons.
Note: there is a typographical error in the table, explained in my notebook, below.
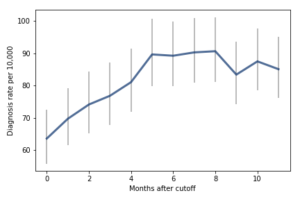
Comparing adjacent months, only one of the differences is statistically significant. But I think there are other ways to look at this data that might make the effect more apparent. The following figure, from my re-analysis, shows diagnosis rates as a function of the difference, in months, between a child’s birth date and the September 1 cutoff:

For the first 9 months, from September to May, we see what we would expect if at least some of the excess diagnoses are due to age-related behavior differences. For each month of difference in age, we see an increase in the number of diagnoses.
This pattern breaks down for the last three months, June, July, and August. This might be explained by random variation, but it also might be due to parental intervention; if some parents hold back students born near the deadline, the observations for these months include some children who are relatively old for their grade and therefore less likely to be diagnosed.
We could test this hypothesis by checking the actual ages of these students when they started school, rather than just looking at their months of birth. I will see whether that additional data is available; in the meantime, I will proceed taking the data at face value.
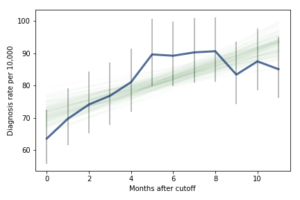
I fit the data using a Bayesian logistic regression model, assuming a linear relationship between month of birth and the log-odds of diagnosis. The following figure shows the fitted models superimposed on the data.
Most of these regression lines fall within the credible intervals of the observed rates, so in that sense this model is not ruled out by the data. But it is clear that the lower rates in the last 3 months bring down the estimated slope, so we should probably consider the estimated effect size to be a lower bound on the true effect size.
To express this effect size in a way that’s easier to interpret, I used the posterior predictive distributions to estimate the difference in diagnosis rate for children born in September and August. The difference is 21 diagnoses per 10,000, with 95% credible interval (13, 30).
As a percentage of the baseline (71 diagnoses per 10,000), that’s an increase of 30%, with credible interval (18%, 42%).
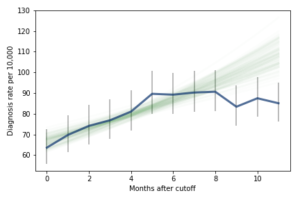
However, if it turns out that the observed rates for June, July, and August are brought down by red-shirting, the effect could be substantially higher. Here’s what the model looks like if we exclude those months:
Of course, it is hazardous to exclude data points because they violate expectations, so this result should be treated with caution. But under this assumption, the difference in diagnosis rate would be 42 per 10,000. On a base rate of 67, that’s an increase of 62%.
Here is the notebook with the details of my analysis:
 For the first 9 months, from September to May, we see what we would expect if at least some of the excess diagnoses are due to age-related behavior differences. For each month of difference in age, we see an increase in the number of diagnoses.
This pattern breaks down for the last three months, June, July, and August. This might be explained by random variation, but it also might be due to parental intervention; if some parents hold back students born near the deadline, the observations for these months include some children who are relatively old for their grade and therefore less likely to be diagnosed.
We could test this hypothesis by checking the actual ages of these students when they started school, rather than just looking at their months of birth. I will see whether that additional data is available; in the meantime, I will proceed taking the data at face value.
I fit the data using a Bayesian logistic regression model, assuming a linear relationship between month of birth and the log-odds of diagnosis. The following figure shows the fitted models superimposed on the data.
For the first 9 months, from September to May, we see what we would expect if at least some of the excess diagnoses are due to age-related behavior differences. For each month of difference in age, we see an increase in the number of diagnoses.
This pattern breaks down for the last three months, June, July, and August. This might be explained by random variation, but it also might be due to parental intervention; if some parents hold back students born near the deadline, the observations for these months include some children who are relatively old for their grade and therefore less likely to be diagnosed.
We could test this hypothesis by checking the actual ages of these students when they started school, rather than just looking at their months of birth. I will see whether that additional data is available; in the meantime, I will proceed taking the data at face value.
I fit the data using a Bayesian logistic regression model, assuming a linear relationship between month of birth and the log-odds of diagnosis. The following figure shows the fitted models superimposed on the data.
 Most of these regression lines fall within the credible intervals of the observed rates, so in that sense this model is not ruled out by the data. But it is clear that the lower rates in the last 3 months bring down the estimated slope, so we should probably consider the estimated effect size to be a lower bound on the true effect size.
To express this effect size in a way that’s easier to interpret, I used the posterior predictive distributions to estimate the difference in diagnosis rate for children born in September and August. The difference is 21 diagnoses per 10,000, with 95% credible interval (13, 30).
As a percentage of the baseline (71 diagnoses per 10,000), that’s an increase of 30%, with credible interval (18%, 42%).
However, if it turns out that the observed rates for June, July, and August are brought down by red-shirting, the effect could be substantially higher. Here’s what the model looks like if we exclude those months:
Most of these regression lines fall within the credible intervals of the observed rates, so in that sense this model is not ruled out by the data. But it is clear that the lower rates in the last 3 months bring down the estimated slope, so we should probably consider the estimated effect size to be a lower bound on the true effect size.
To express this effect size in a way that’s easier to interpret, I used the posterior predictive distributions to estimate the difference in diagnosis rate for children born in September and August. The difference is 21 diagnoses per 10,000, with 95% credible interval (13, 30).
As a percentage of the baseline (71 diagnoses per 10,000), that’s an increase of 30%, with credible interval (18%, 42%).
However, if it turns out that the observed rates for June, July, and August are brought down by red-shirting, the effect could be substantially higher. Here’s what the model looks like if we exclude those months:
 Of course, it is hazardous to exclude data points because they violate expectations, so this result should be treated with caution. But under this assumption, the difference in diagnosis rate would be 42 per 10,000. On a base rate of 67, that’s an increase of 62%.
Here is the notebook with the details of my analysis:
Of course, it is hazardous to exclude data points because they violate expectations, so this result should be treated with caution. But under this assumption, the difference in diagnosis rate would be 42 per 10,000. On a base rate of 67, that’s an increase of 62%.
Here is the notebook with the details of my analysis: