Why are you so slow?
Recently a shoe store in France ran a promotion called “Rob It to Get It”, which invited customers to try to steal something by grabbing it and running out of the store. But there was a catch — the “security guard” was a professional sprinter, Méba Mickael Zeze. As you would expect, he is fast, but you might not appreciate how much faster he is than an average runner, or even a good runner.
Why? That’s the topic of Chapter 4 of Probably Overthinking It, which is available for preorder now. Here’s an excerpt.
Running Speeds
If you are a fan of the Atlanta Braves, a Major League Baseball team, or if you watch enough videos on the internet, you have probably seen one of the most popular forms of between-inning entertainment: a foot race between one of the fans and a spandex-suit-wearing mascot called the Freeze.
The route of the race is the dirt track that runs across the outfield, a distance of about 160 meters, which the Freeze runs in less than 20 seconds. To keep things interesting, the fan gets a head start of about 5 seconds. That might not seem like a lot, but if you watch one of these races, this lead seems insurmountable. However, when the Freeze starts running, you immediately see the difference between a pretty good runner and a very good runner. With few exceptions, the Freeze runs down the fan, overtakes them, and coasts to the finish line with seconds to spare.
Here are some examples:
But as fast as he is, the Freeze is not even a professional runner; he is a member of the Braves’ ground crew named Nigel Talton. In college, he ran 200 meters in 21.66 seconds, which is very good. But the 200 meter collegiate record is 20.1 seconds, set by Wallace Spearmon in 2005, and the current world record is 19.19 seconds, set by Usain Bolt in 2009.
To put all that in perspective, let’s start with me. For a middle-aged man, I am a decent runner. When I was 42 years old, I ran my best-ever 10 kilometer race in 42:44, which was faster than 94% of the other runners who showed up for a local 10K. Around that time, I could run 200 meters in about 30 seconds (with wind assistance).
But a good high school runner is faster than me. At a recent meet, the fastest girl at a nearby high school ran 200 meters in about 27 seconds, and the fastest boy ran under 24 seconds.
So, in terms of speed, a fast high school girl is 11% faster than me, a fast high school boy is 12% faster than her; Nigel Talton, in his prime, was 11% faster than him, Wallace Spearmon was about 8% faster than Talton, and Usain Bolt is about 5% faster than Spearmon.
Unless you are Usain Bolt, there is always someone faster than you, and not just a little bit faster; they are much faster. The reason is that the distribution of running speed is not Gaussian — It is more like lognormal.
To demonstrate, I’ll use data from the James Joyce Ramble, which is the 10 kilometer race where I ran my previously-mentioned personal record time. I downloaded the times for the 1,592 finishers and converted them to speeds in kilometers per hour. The following figure shows the distribution of these speeds on a logarithmic scale, along with a Gaussian model I fit to the data.
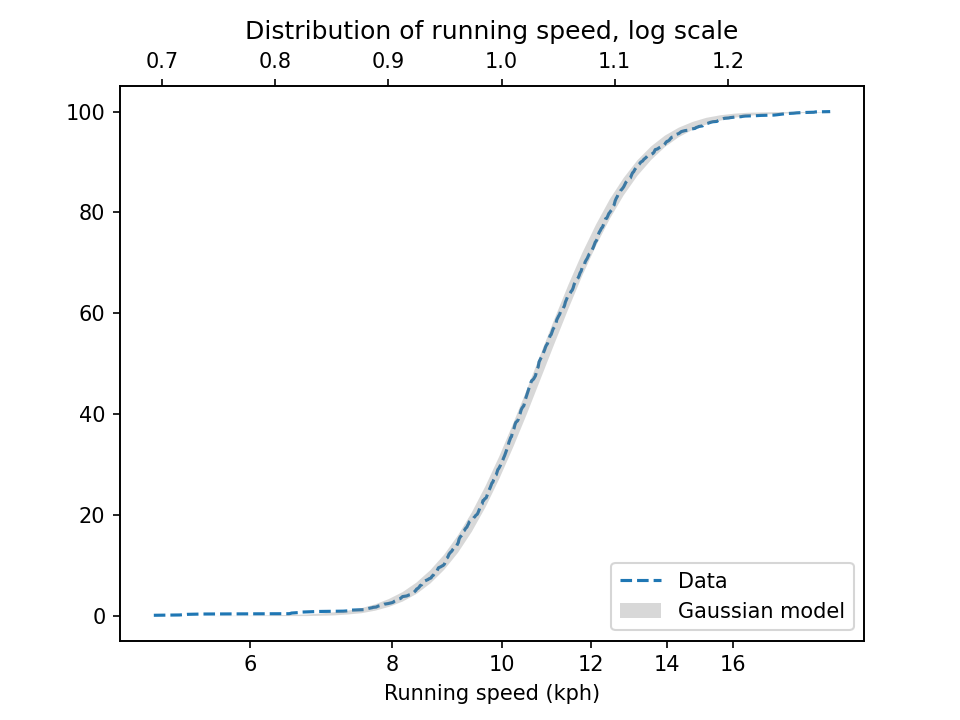
The logarithms follow a Gaussian distribution, which means the speeds themselves are lognormal. You might wonder why. Well, I have a theory, based on the following assumptions:
- First, everyone has a maximum speed they are capable of running, assuming that they train effectively.
- Second, these speed limits can depend on many factors, including height and weight, fast- and slow-twitch muscle mass, cardiovascular conditioning, flexibility and elasticity, and probably more.
- Finally, the way these factors interact tends to be multiplicative; that is, each person’s speed limit depends on the product of multiple factors.
Here’s why I think speed depends on a product rather than a sum of factors. If all of your factors are good, you are fast; if any of them are bad, you are slow. Mathematically, the operation that has this property is multiplication.
For example, suppose there are only two factors, measured on a scale from 0 to 1, and each person’s speed limit is determined by their product. Let’s consider three hypothetical people:
- The first person scores high on both factors, let’s say 0.9. The product of these factors is 0.81, so they would be fast.
- The second person scores relatively low on both factors, let’s say 0.3. The product is 0.09, so they would be quite slow.
So far, this is not surprising: if you are good in every way, you are fast; if you are bad in every way, you are slow. But what if you are good in some ways and bad in others?
- The third person scores 0.9 on one factor and 0.3 on the other. The product is 0.27, so they are a little bit faster than someone who scores low on both factors, but much slower than someone who scores high on both.
That’s a property of multiplication: the product depends most strongly on the smallest factor. And as the number of factors increases, the effect becomes more dramatic.
To simulate this mechanism, I generated five random factors from a Gaussian distribution and multiplied them together. I adjusted the mean and standard deviation of the Gaussians so that the resulting distribution fit the data; the following figure shows the results.
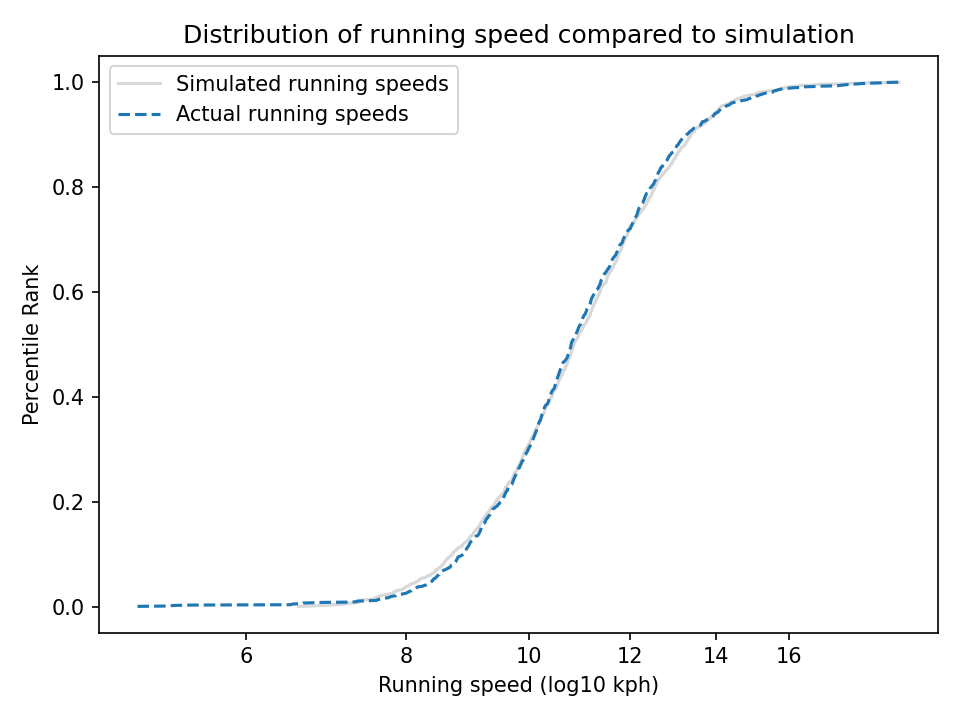
The simulation results fit the data well. So this example demonstrates a second mechanism [the first is described earlier in the chapter] that can produce lognormal distributions: the limiting power of the weakest link. If there are at least five factors affect running speed, and each person’s limit depends on their worst factor, that would explain why the distribution of running speed is lognormal.
And that’s why you can’t beat the Freeze.
You can read about the “Rob It to Get It” promotion in this article and watch people get run down in this video.