The Student-t model of Long-Tailed Distributions
As I’ve mentioned, I’m working on a book called Probably Overthinking It, to be published in early 2023. It’s intended for a general audience, so I’m not trying to do research, but I might have found something novel while working on a chapter about power law distributions.
If you are familiar with the topic, you know that there are a bunch of distributions in natural and engineered systems that seem to follow a power law. But ever since people have claimed to find power law distributions, other people have said, “Not so fast”. There are two persistent problems with power law distributions:
- They generally don’t fit the left part of the distribution, only the tail.
- They don’t fit the whole tail; in the extreme, the data usually drop off faster than a real power law.
On the other hand, a lognormal distribution often fits the left part of these distributions, but it’s not always good model for the tail.
Well, what if there was another simple, well-known model that fits the entire distribution? I think there is, at least for some datasets: the Student-t distribution.
For example, here’s the distribution of city sizes in the U.S. from the 2020 Census. On the left is the survival function (complementary CDF), with city size on a log scale. On the right is the survival function again, with the y-axis also on a log scale.
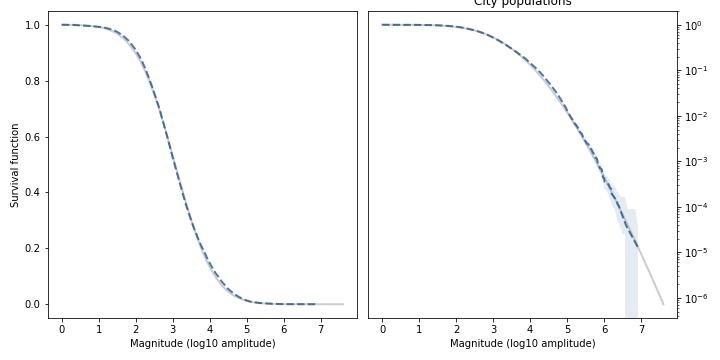
The dashed line is the data; the shaded area is a 90% CI based on the data; and the gray line is the model, with parameters chosen to match the data. On the left, the Student-t model fits the data over the entire range; on the right, it also fits the tail over five orders of magnitude.
Here’s the distribution of earthquake magnitudes in California (the Richter scale is already logarithmic, so no need to transform).
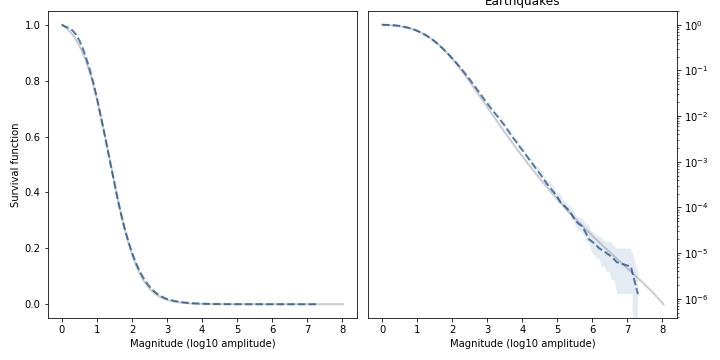
Again, the model fits the survival function well over the entire range, and also fits the tail over almost six orders of magnitude.
As another example, here’s the distribution of magnitudes for solar flares (logarithms of integrated flux in J/m²):
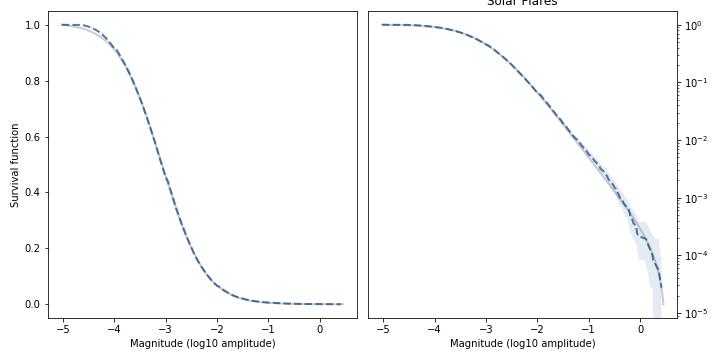
Again, the model fits the data well in the body and the tail of the distribution. At the top of the left figure, we can see that there are not as many small-magnitude flares as the model expects, but that might be because we don’t detect all of them.
Finally, here are the relative changes in the daily closing price of the Dow Jones Industrial Average (thanks to Samuel H. Williamson), going all the way back to 1896.
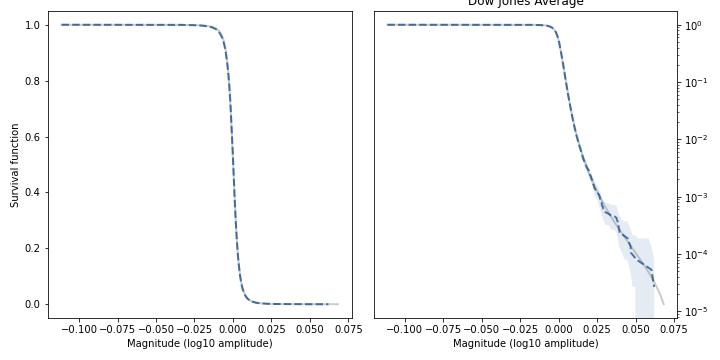
The Student-t model is a remarkably good fit for the data.
Notably, the model is capable of matching tail curves with different shapes:
- The tail of the city size distribution drops off with increasing curvature.
- The tail of the earthquake distribution is initially curved and then straight.
- The tail of the solar flare distribution is initially curved, then straight, then drops off again.
- The tail of the changes in stock prices curves upward over a large part of the range.
You might think it would take a lot of parameters to track these different shapes, but the Student-t model has only three: location, scale, and tail thickness. It’s a bit of a pain to fit the model to data — I had to break out some optimization tools from SciPy. But at least I didn’t have to fit it by hand.
I’m not sure how much of this discussion will end up in the book, but if you would like to receive infrequent notifications about Probably Overthinking It (and possibly a discount), please sign up for this mailing list.