Young Adults Are Not Very Happy
Since 1972, the General Social Survey has asked respondents: “Taken all together, how would you say things are these days—would you say that you are very happy, pretty happy, or not too happy?”
The following figure shows how the responses have changed over time and between birth cohorts. Each line represents one birth year.
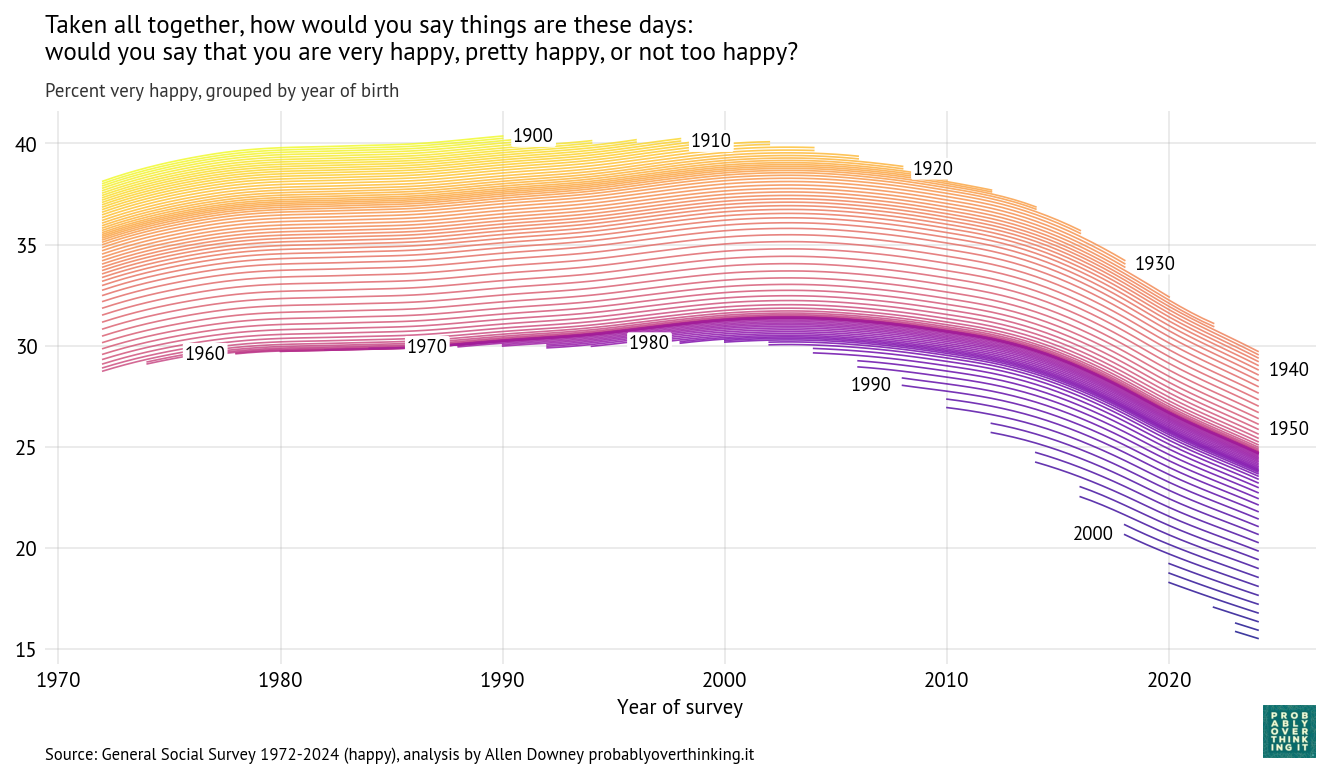
People born in 1900 were 72 years old when the survey started; at that point, about 37% said they were very happy. In 1990, the last year they were eligible to participate, a little more than 40% said they were very happy. So it seems like they aged well—or possibly the less happy died earlier.
People born in 1910 were a little less happy when the survey started, but by the time they aged out, they also reached 40%. They were the last generation to reach that mark.
Among people born between 1920 and 1950, each cohort was a little less happy than the one before (or maybe less likely to say they were happy). In these cohorts, we can see a general trend over time: increasing until about 2000, leveling off, and declining after 2010.
The cohorts born in the 1960s and 1970s followed a similar trajectory, with only small differences from one birth year to the next.
And then the bottom fell out. Starting with people born in the 1980s (the earliest Millennials), each successive cohort was substantially less happy than the one before.
When people born in 1990 joined the survey in 2008 (at age 18), only 27% said they were very happy. In the most recent data, from 2024, the number had fallen to 22%.
When people born in 2000 entered in 2018, they set a new record low at 21%, which has now fallen to 18%.
And in the most recent cohort—born in 2006 and interviewed in 2024—only 16% said they were very happy.
These percentages are based on a statistical model that estimates the proportion of “very happy” responses in each group at each point in time. The details of the model and its assumptions are below.
The Time Trend
With an estimated proportion for each cohort and time step, we can compute separate contributions for changes over time and between cohorts.
To characterize the contribution of time, we have to hold the cohort effect constant, which we can do by computing the distribution of birth years across the entire dataset and simulating a population where this distribution does not change over time. The following figure shows the result.
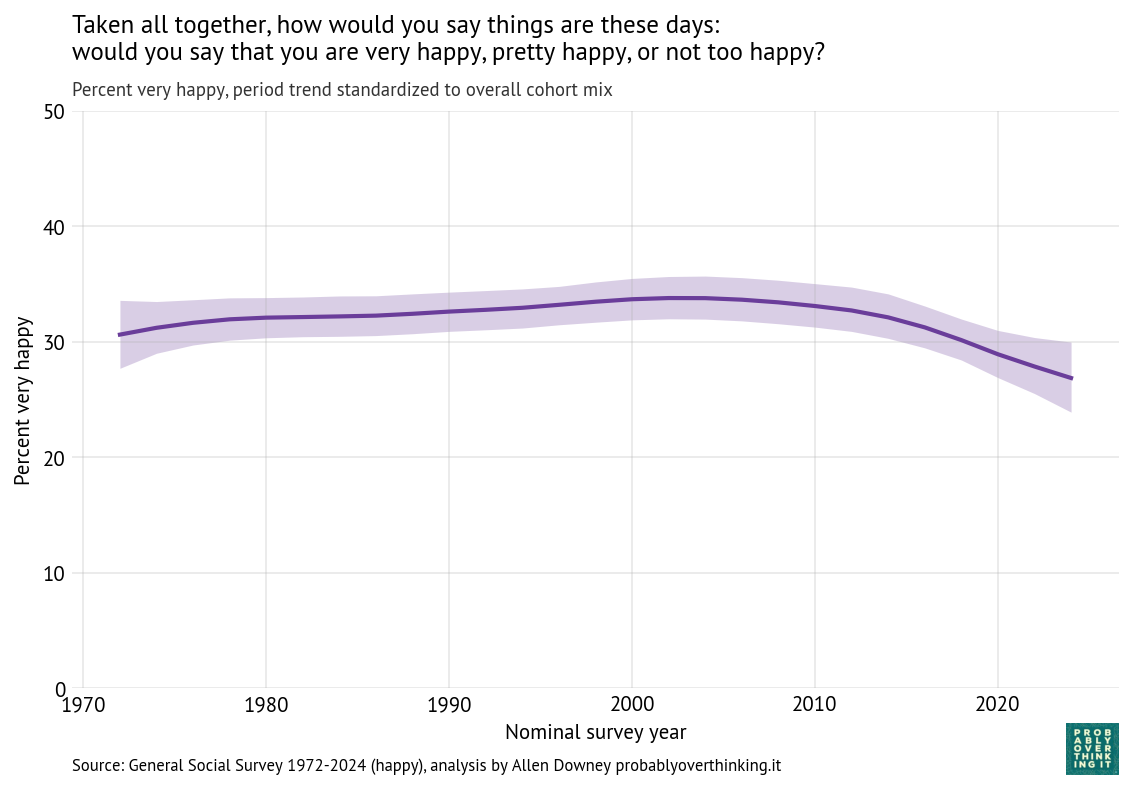
The overall level of happiness increased between 1972 and 2000, leveled off, and then declined after 2010.
Of course it is speculation to say why that happened, but we can think about large-scale economic and social patterns and how they line up with these trends.
- Economically, 1980 to 2000 was a period of growth and relative stability. That changed after the end of the Dot-com bubble in 2001 and, more importantly, the Global Financial Crisis in 2008, which had broad and persistent effects on employment, wealth, and economic security.
- Geopolitically, the 1970s through the 1990s were relatively quiet compared to what followed. The September 11 attacks in 2001, and the wars in Iraq (2003–2011) and Afghanistan (2001–2021) marked a shift toward a more uncertain and conflict-oriented global environment.
- Participation in civic organizations and religious institutions declined over the past several decades. These institutions traditionally provided social support, shared identity, and regular face-to-face interaction. Social isolation is strongly associated with lower well-being.
- At the same time, the media environment was transformed. The rise of 24-hour news increased exposure to negative and emotionally salient events, and after 2010 the spread of smartphones and social media made that exposure continuous and personalized.
- Finally, measures of trust in institutions and other people have generally declined over this period, while political polarization has increased. These trends may reduce people’s sense of stability and shared purpose.
The COVID-19 pandemic likely contributed to the most recent decline, but the downward trend was already underway before 2020.
The Cohort Effect
Just as we isolated the time trend by simulating a survey with a fixed distribution of cohorts, we can isolate the cohort effect by simulating a survey with a fixed distribution of times. The following figure shows the result.
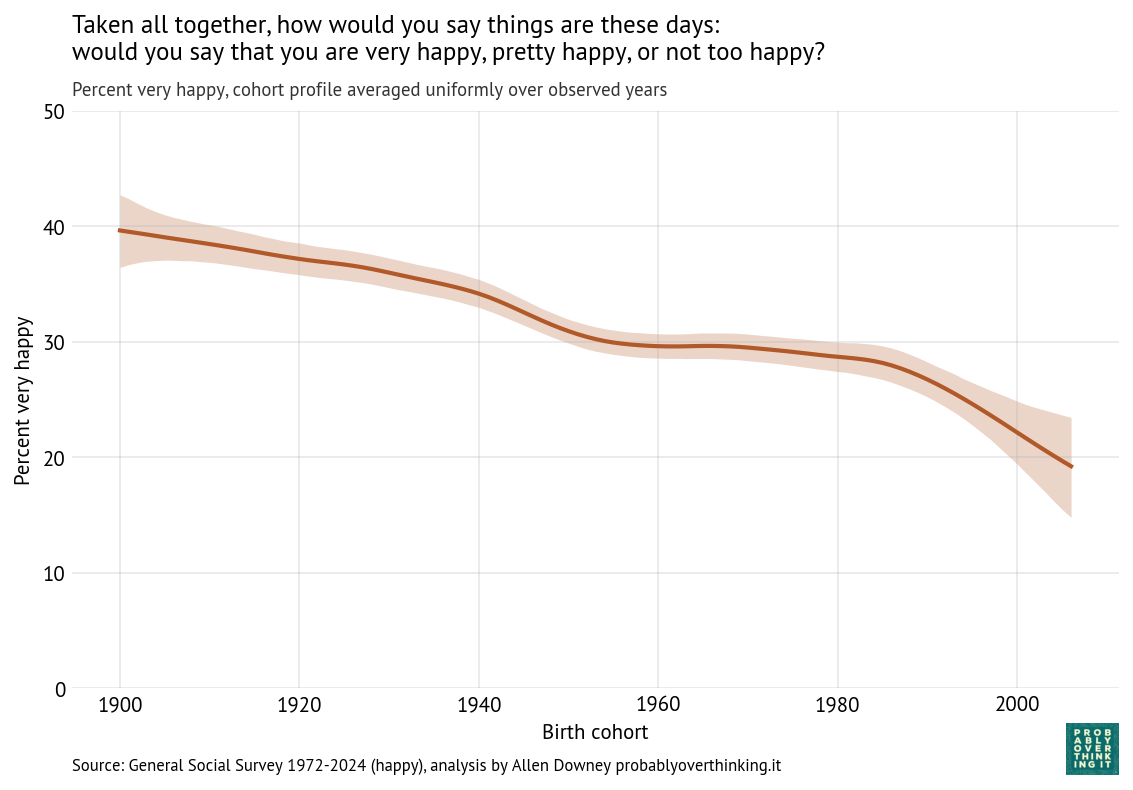
The cohort effect is larger and more consistent than the time trend: the difference between the happiest and least happy cohorts is more than 20 percentage points.
The decline was relatively slow for cohorts born between 1900 and 1950 and nearly zero for cohorts born in the 1950s, 1960s and 1970s (late Baby Boomers and Gen X). The steep decline begins with the Millennials and continues into Gen Z.
Possible explanations for the recent decline include:
- Transformation of childhood: Jonathan Haidt has described childhood in recent cohorts as “overprotected in the real world and underprotected in the online world.” Increased parental monitoring, reduced independent play, and greater time spent online may affect the development of autonomy, risk tolerance, and social skills. If these early-life experiences shape long-term outlook, they could contribute to lower self-reported happiness.
- Greater and earlier exposure to media: Younger cohorts were exposed to a media landscape characterized by continuous, personalized, and often negative content. Social media platforms amplify social comparison and negative content, while displacing in-person interaction. Increased awareness of global risks—including climate change—may contribute to a more pessimistic worldview.
- Differential impact of economic conditions: Recent cohorts entered the labor market during periods of economic disruption, including the aftermath of the Global Financial Crisis and more recent pandemic-related shocks. These cohorts also face higher housing costs and greater student debt. Economic insecurity during the transition to adulthood may have lasting effects on well-being.
- Extension of “liminal” adulthood: Young adults are taking longer to complete education, establish careers, form long-term partnerships, and have children. This extended unsettled period may be associated with lower life satisfaction.
- Norms around self-reported well-being. Younger cohorts may also be less likely to say they are “very happy,” either because of changing norms around self-presentation or greater awareness of mental health.
It’s hard to say how much of the recent decline we can attribute to these causes. But the decline is steep, and seems to be ongoing.
How the Model Works
One of the challenges with this kind of survey data is that the sample size is small for each birth year in each iteration of the survey. If we plot raw percentages over time, the result is noisy.
In Probably Overthinking It, I addressed this problem by grouping respondents into decade-of-birth cohorts and smoothing the resulting time series. That approach works, but it has drawbacks: aggregation removes detail, introduces edge effects for the earliest and latest cohorts, and requires an arbitrary choice about the level of smoothing.
The new model takes a more principled approach. Instead of smoothing the observed data, it models an unobserved (latent) propensity to report being “very happy” for each cohort in each year.
We assume that the number of “very happy” responses in each group follows a binomial distribution, where the probability of a “very happy” response depends on this latent propensity. The observed responses provide noisy information about the latent factor; the model combines information across cohorts and years to estimate it.
The latent propensity is modeled as the sum of an intercept, representing the overall level of happiness, a smooth effect of birth cohort, a smooth effect of survey year, and a year-specific random effect that captures short-term fluctuations (overdispersion).
The cohort and period effects are modeled as second-order Gaussian random walks (RW2), which means the model assumes these effects evolve smoothly over time, with a preference for gradual changes in slope rather than abrupt jumps, unless the data provide strong evidence otherwise. The amount of smoothing is not fixed in advance; it is estimated from the data.
The random year effect captures variation from one survey to the next that is not explained by long-term trends, like current events and topics of discussion.
Where we have a lot of data, the estimates track the observed proportions closely. Where data are sparse, the model borrows strength from neighboring cohorts and years, providing principled smoothing and interpolation without arbitrary grouping.
For the details of the model, see the Technical Report.