The Overton Paradox in Three Graphs
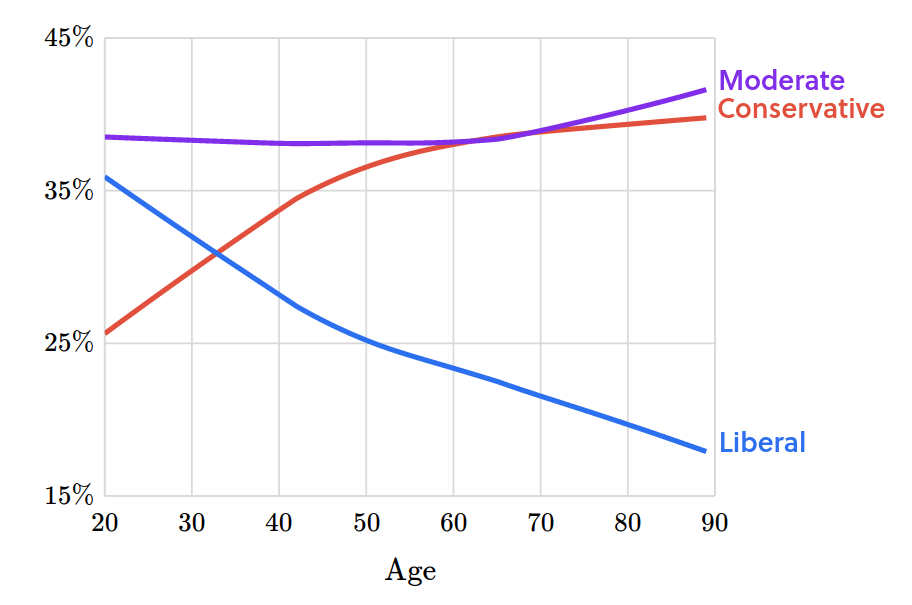
Older people are more likely to say they are conservative.
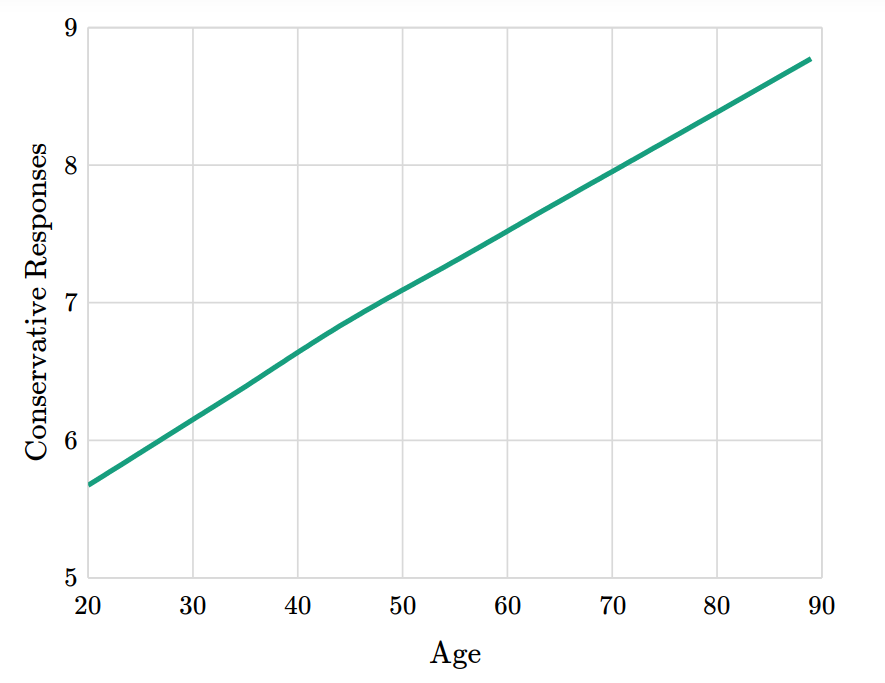
And older people believe more conservative things.
But if you group people by decade of birth, most groups get more liberal as they get older.
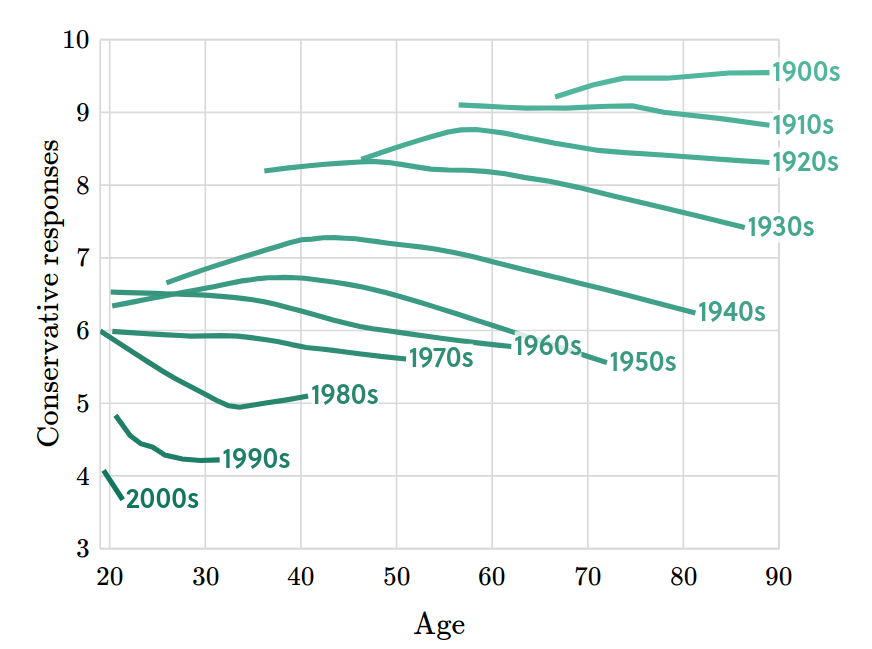
So if people get more liberal, on average, why are they more likely to say they are conservative?
Now there are three ways to find out!
- Today Brilliant launched an interactive article explaining the Overton Paraodox.
- Also today, the SuperDataScience Podcast published a conversation about Probably Overthinking It, including a discussion of the Overton Paradox. You can also watch the video on YouTube.
- And I gave a talk about it at PyData NYC 2022, which you can watch here.
Since some people have asked, I should say that “Overton Paradox” is the name I am giving this phenomenon. It’s named after the Overton window, for reasons that will be clear if you read my explanation.
This topic is part of my book in progress, You Would Choose Now, which uses decades of survey data to track changing attitudes in the United States. The early access edition is available now.