Changing Opinions on Assisted Suicide
In Graphs About Religion, Ryan Burge recently wrote about changing opinions about assisted suicide and how they relate to religion.
As always, when I see survey responses changing over time, I wonder whether it is driven primarily by period or cohort effects. And if you’ve read my last few posts, you know I’ve been working on a Bayesian model to answer that question.
Ryan’s analysis is based on four questions from the General Social Survey (GSS):
Do you think a person has the right to end his or her own life if this person:
- Has an incurable disease? (
suicide1)- Has gone bankrupt? (
suicide2)- Has dishonored his or her family? (
suicide3)- Is tired of living and ready to die? (
suicide4)
In addition, we’ll look at results from a related question (letdie1):
When a person has a disease that cannot be cured, do you think doctors should be allowed by law to end the patient’s life by some painless means if the patient and his family request it?
The framing of the questions is different: the first four are about the right to end one’s life and the last is about the legality of doctor-assisted suicide.
Before we look at the breakdown of period and cohort effects, here are the results from a model that estimates latent opposition to each proposition as a smooth function over time.
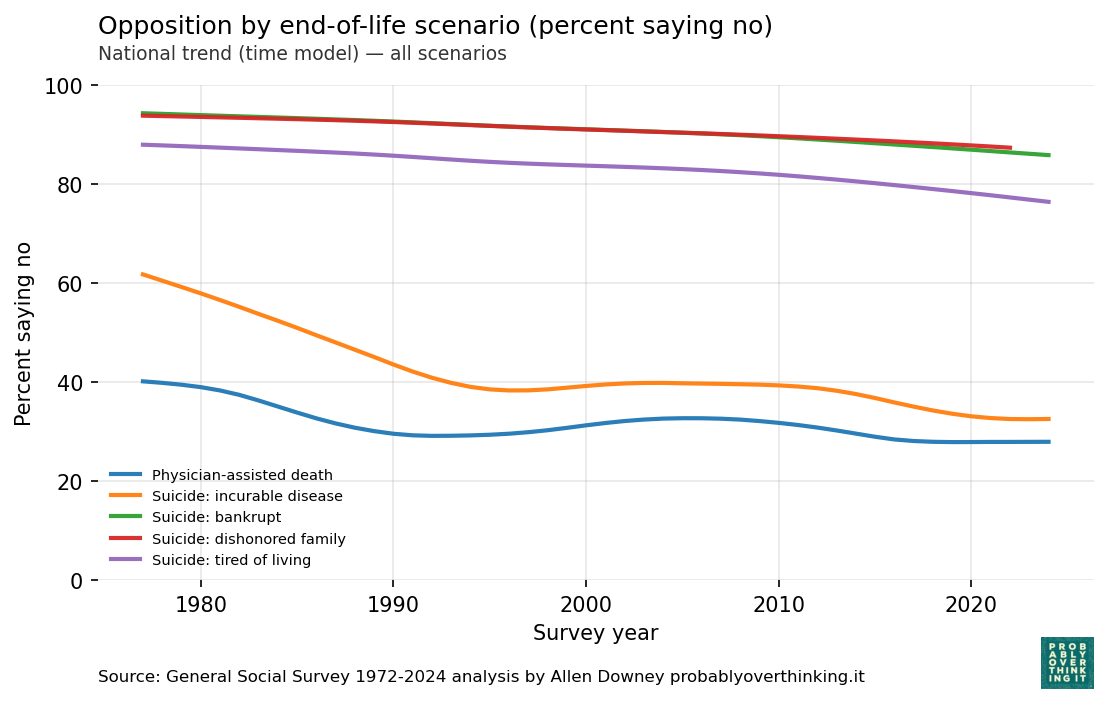
Opposition to suicide is high in three of the scenarios — bankrupt, dishonored family, and tired of living — and lower in the incurable disease scenarios.
In all five questions, opposition has declined over time, although for the incurable disease scenarios, it might have leveled off after 1990.
Doctor-assisted death
Now let’s see if we can decompose these changes into period and cohort effects. We’ll start with the question about doctor-assisted death when the patient has an incurable disease.
As in the previous posts, I used a Bayesian model to estimate a trajectory over time for each birth cohort, shown in the following figure.
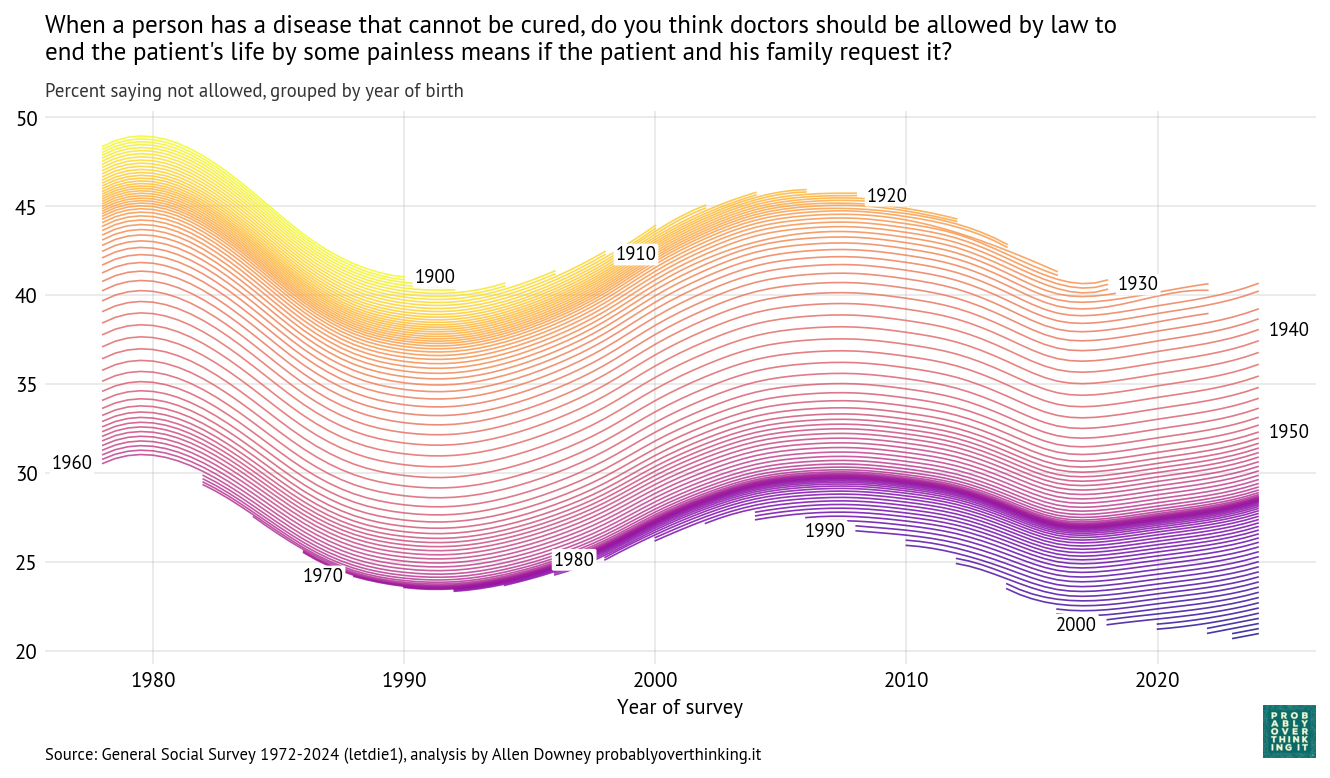
Reading from top to bottom, we can see that opposition has declined from one cohort to the next, and reading from left to right, we can see that opposition has varied over time within each cohort.
The following figure shows the cohort component alone, standardized to factor out the period effect.
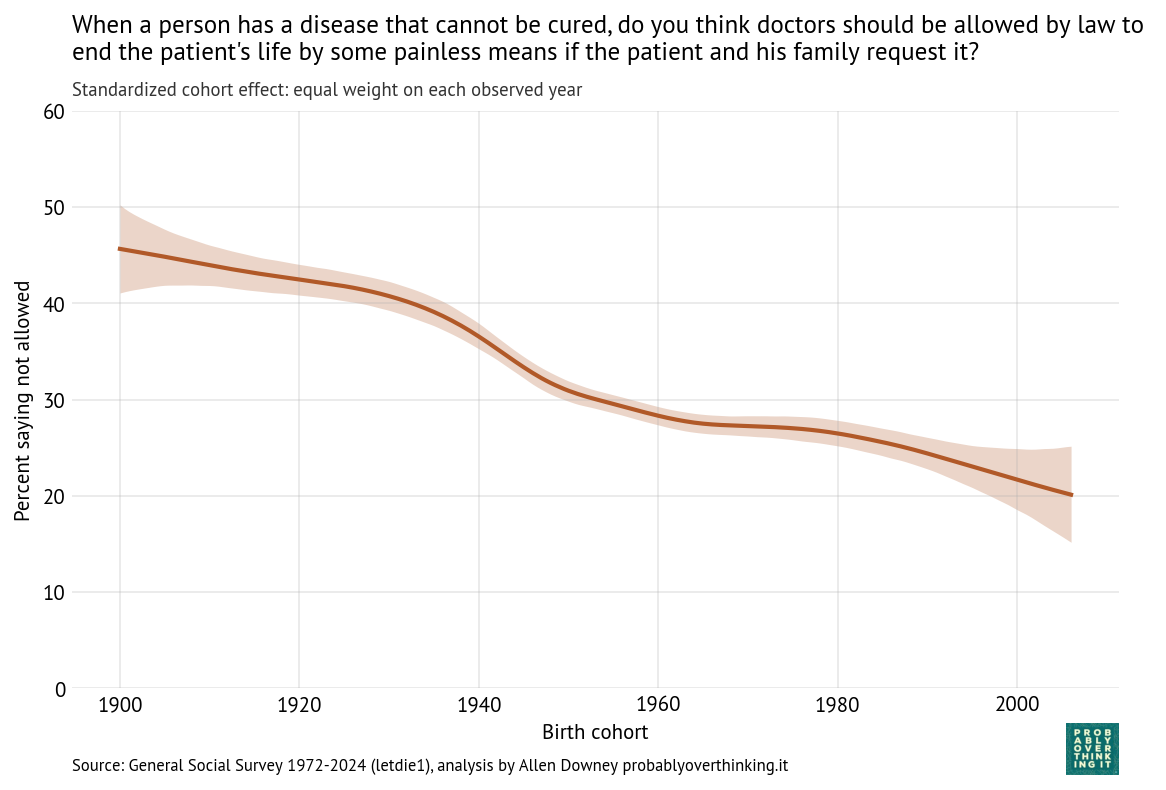
Opposition to doctor-assisted suicide has declined from more than 40% in the earliest cohorts to 20% among people born in 2006.
A possible explanation for the cohort pattern is that people anchor their moral judgments to the legal environment they encounter when they are young. During the “impressionable years” of late adolescence and early adulthood, existing laws can establish a moral baseline, so that what is illegal is inferred to be wrong, and therefore should remain illegal. As a result, gradual legalization can generate long-run attitudinal change through cohort replacement: people who grow up after a practice becomes legal are less likely to see it as morally problematic.
The following figure shows the period effect alone, along with the results from the time model (which includes both period and cohort effects).
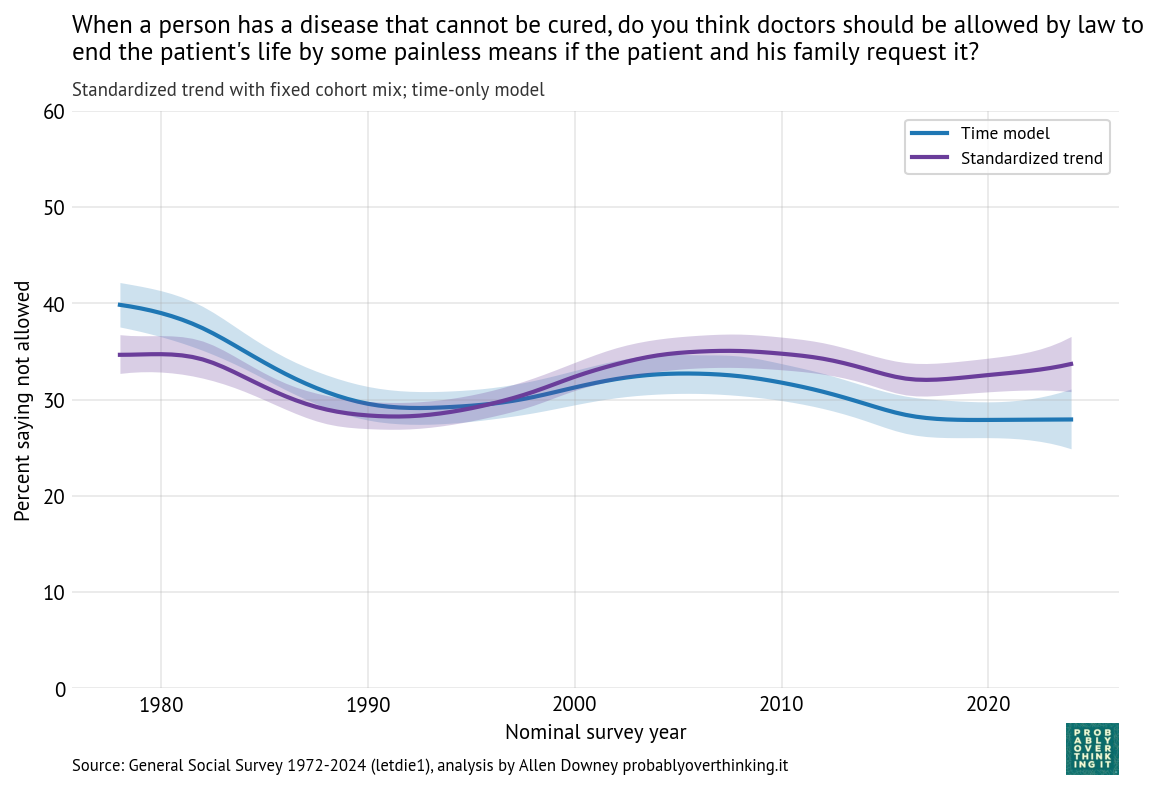
Comparing the two lines, we can conclude that the decline we see over time is entirely due to the cohort effect — when we control for generational replacement, the estimated period effect has generally increased since 1990.
The increase between 1990 and 2005 might reflect increasing moral concern due to advances in life-sustaining medical technology, high-profile legal disputes like the Terri Schiavo case, and broader discussions of the sanctity of life.
The decline between 2005 to 2015 might reflect normalization of assisted dying following legalization in several states (Oregon in 1997, Washington in 2008, and Montana in 2009, Vermont in 2013), along with a shift in public discourse toward autonomy, dignity, and patient choice, reinforced by high-profile cases like Brittany Maynard.
Other Scenarios
The following figure shows the estimated cohort effects for all five questions.
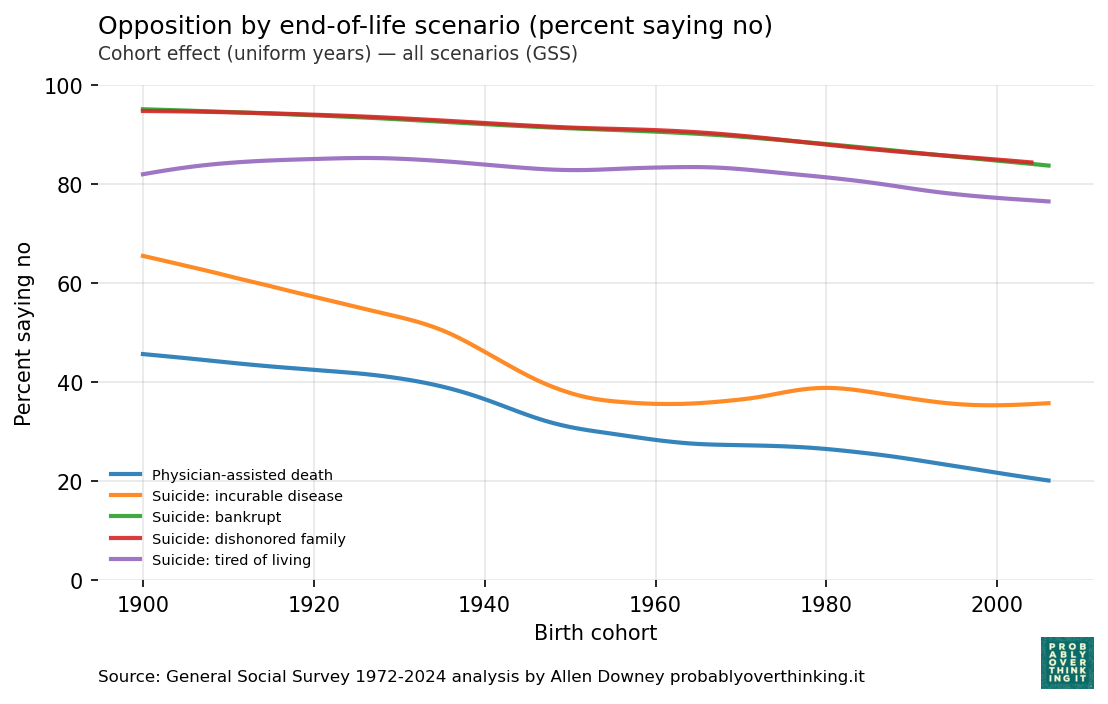
For the incurable disease scenario, opposition has declined from more than 60% in the earliest cohorts to less than 40% among cohorts born after 1950 — although it might have leveled off since then.
In the other scenarios, opposition has also declined from one cohort to the next, but the size of the effect is smaller.
The following figure shows the estimated period effects, controlling for generational replacement.
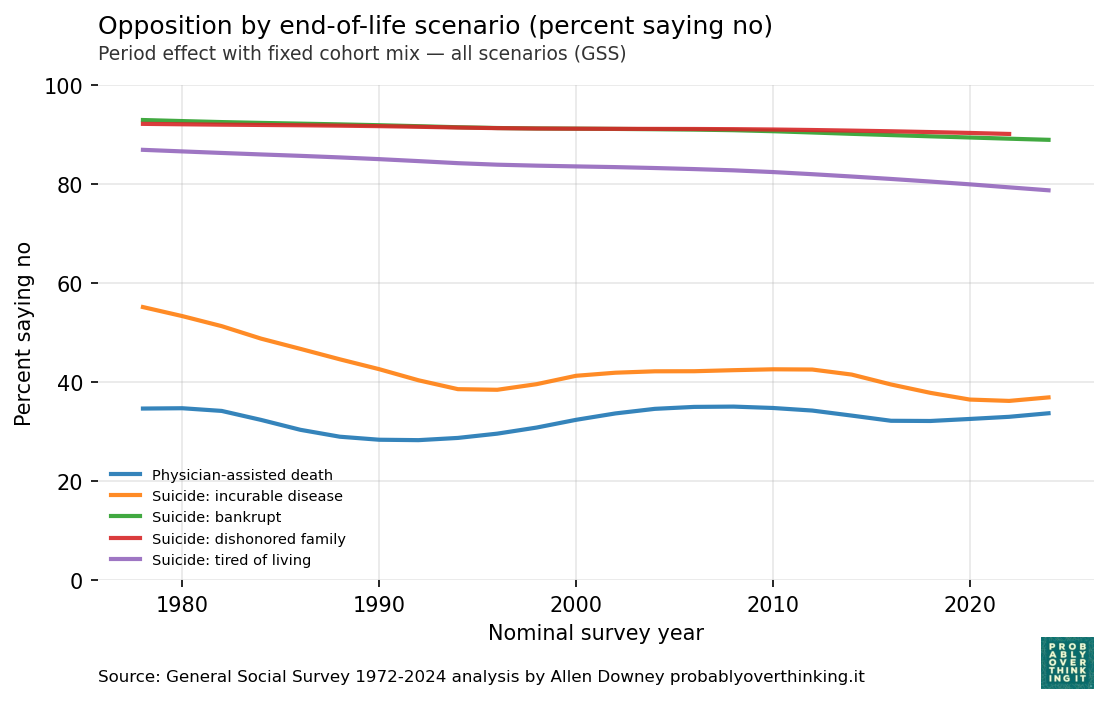
Since 1990, most of the period effects are small. The only exception is the “tired of living” scenario, where there is some decline over time, independent of generational replacement.
In the next post, we’ll do the same analysis with questions about abortion and the situations where it should be legal or not.