Berkson Goes to College
This article is like a pre-excerpt from my forthcoming book, Probably Overthinking It: a revised version of this article make up part of the chapter about Berkson’s paradox. If you would like to get an occasional update about the book, please join my mailing list.
Suppose one day you visit Representative College, where the student body is a representative sample of the college population. You meet a randomly chosen student and you learn (because it comes up in conversation) that they got a 600 on the SAT Verbal test, which is about one standard deviation above the mean. What do you think they got on the SAT Math test?
- A: 600 or more
- B: Between 500 and 600 (above the mean)
- C: Between 400 and 500 (below the mean)
- D: 400 or less
If you chose B, you are right! Scores on the SAT Math and Verbal tests are correlated, so if someone is above average on one, they are probably above average on the other. The correlation coefficient is about 0.7, so people who get 600 on the verbal test get about 570 on the math test, on average.
Now suppose you visit Elite University, where the average score on both tests is 700. You meet a randomly chosen student and you learn (because they bring it up) that they got a 750 on the verbal test, which is about one standard deviation above the mean at E.U. What do you think they got on the math test?
- A: 750 or more
- B: Between 700 and 750 (above the mean)
- C: Between 650 and 700 (below the mean)
- D: 650 or less
If you chose B again, you are wrong! Among students at E.U., the correlation between test scores is negative. If someone is above average on one, they are probably below average on the other.
This is an example of Berkson’s paradox, which is a form of selection bias. In this case, the selection is the college admission process, which is partly based on exam scores. And the effect, at elite colleges and universities, is a negative correlation between test scores, even though the correlation in the general population is positive.
Data
To see how it works in this example, let’s look at some numbers. I got data from the National Longitudinal Survey of Youth 1997 (NLSY97), which “follows the lives of a sample of [8,984] American youth born between 1980-84”. The public data set includes the participants’ scores on several standardized tests, including the SAT and ACT.
About 1400 respondents took the SAT. Their average and standard deviation are close to the national average (500) and standard deviation (100). And the correlation is about 0.73. To get a sense of how strong that is, here’s what the scatter plot looks like.
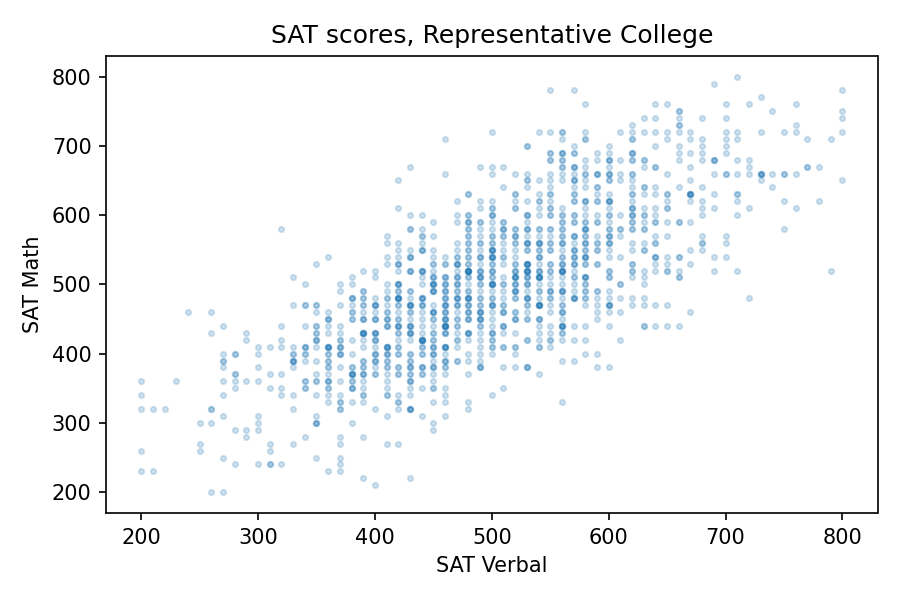
Since the correlation is about 0.7, someone who is one standard deviation above the mean on the verbal test is about 0.7 standard deviations above the mean on the math test, on average. So at Representative College, if we select people with verbal scores near 600, their average math score is about 570.
Elite University
Now let’s see what happens when we select students for Elite University. Suppose that in order to get into E.U., your total SAT score has to be 1320 or higher. If we select students who meet or exceed that threshold, their average on both tests is about 700, and the standard deviation is about 50.
Among these students, the correlation between test scores is about -0.33, which means that if you are one standard deviation above the E.U. mean on one test, you are about 0.33 standard deviations below the E.U. mean on the other, on average.
The following figure shows why this happens:
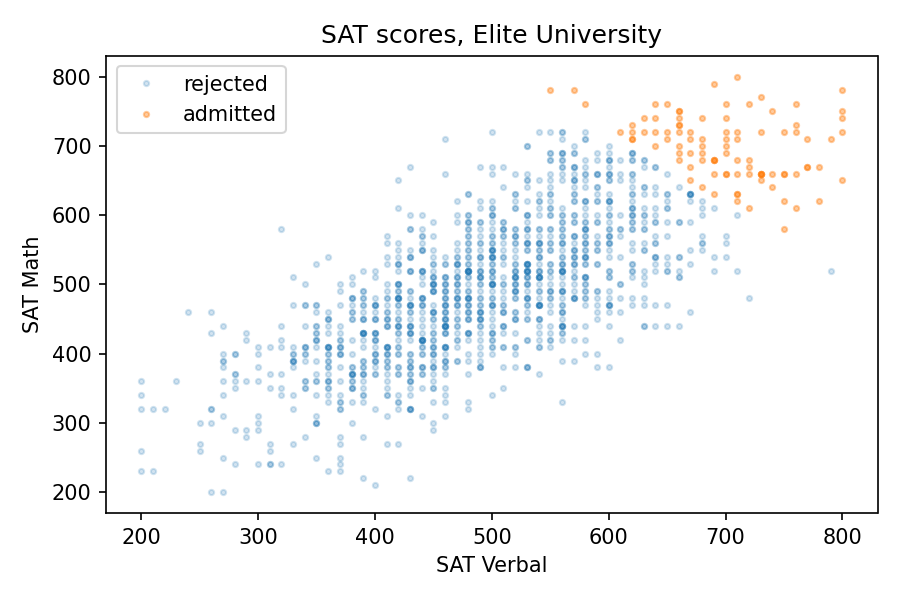
The students who meet the admission requirements at Elite University form a triangle in the upper right, with a moderate negative correlation between test scores.
Specialized University
Of course, most admissions decisions are based on more than the sum of two SAT scores. But we get the same effect even if the details of the admission criteria are different. For example, suppose another school, Specialized University, admits students if either test score is 720 or better, regardless of the other score.
With this threshold, the mean for both tests is close to 700, the same as Elite University, and the standard deviations are a little higher. But again, the correlation is negative, and a little stronger than at E.U., about -0.38, compared to -0.33.
The following figure shows the distribution of scores for admitted students.
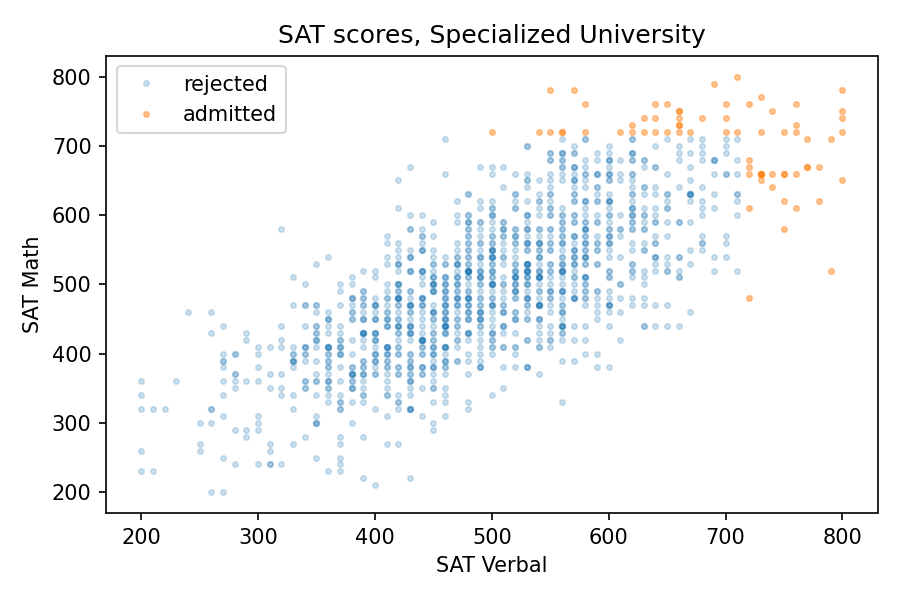
There are three kinds of students Specialized University: good at math, good at language, and good at both. But the first two groups are bigger than the third, so the overall correlation is negative.
Sweep the Threshold
Now let’s see what happens as we vary the admissions requirements. I’ll go back to the previous version, where admission depends on the total of the two tests, and vary the threshold.
As we increase the threshold, the average total score increases and the correlation decreases. The following figure shows the results.
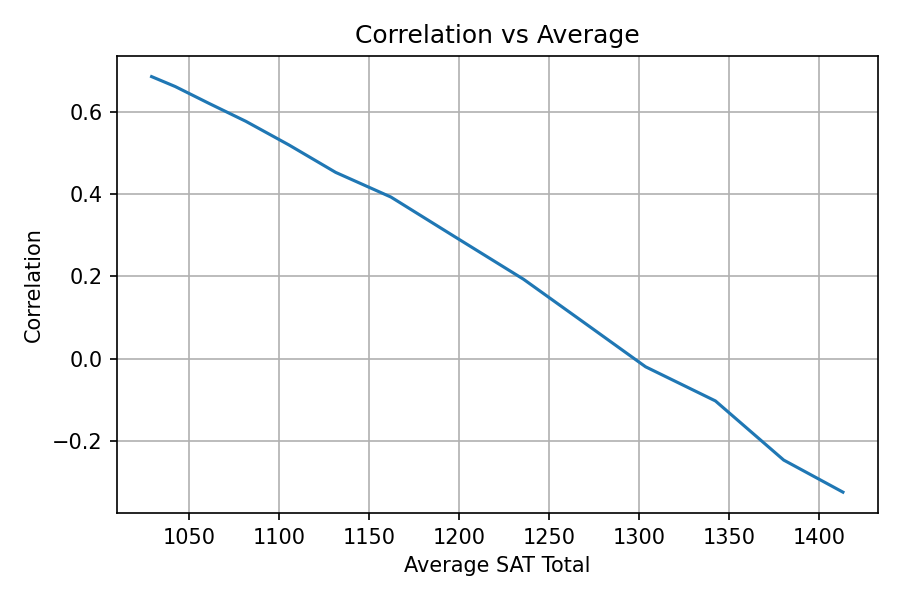
At Representative College, where the average total SAT is near 1000, test scores are strongly correlated. At Elite University, where the average is over 1400, the correlation is moderately negative.
Secondtier College
But at a college that is selective but not elite, the effect might be even stronger than that. Suppose at Secondtier College (it’s pronounced “seh con’ tee ay'”), a student with a total score of 1220 or more is admitted, but a student with 1320 or more is likely to go somewhere else.
In that case, the average total score would be about 1260. So, based on the parameter sweep in the previous section, we would expect a weak positive correlation, but the correlation is actually strongly negative, about -0.8! The following picture shows why.
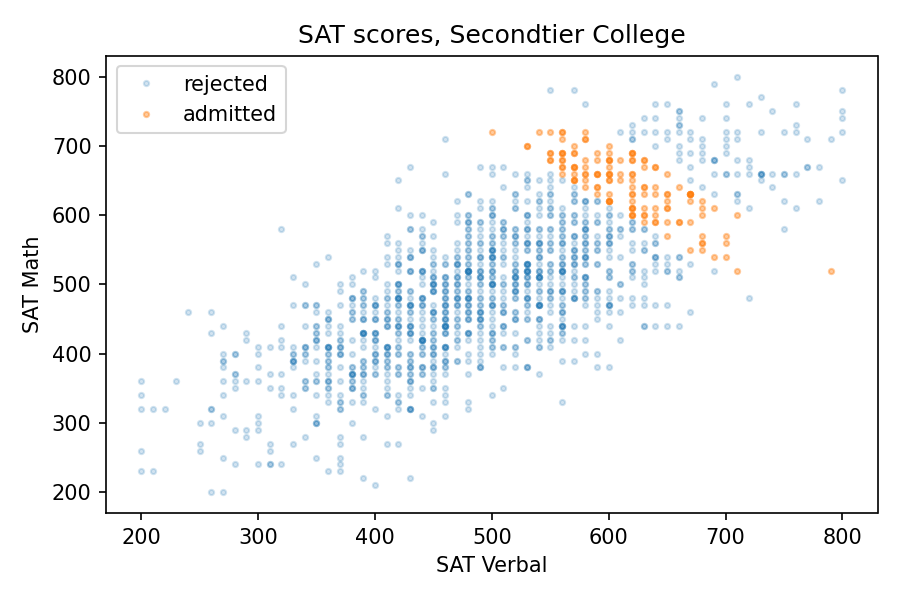
At Secondtier, if you meet a student who got a 690 on the math test, about one standard deviation above the mean, you should expect them to get a 580 on the verbal test, on average. That’s a remarkable effect.
Summary
Among the students at a given college or university, verbal skills and math skills might be strongly correlated, anti-correlated, or uncorrelated, depending on how the students are selected. This is an example of Berkson’s paradox.
If you enjoy this kind of veridical paradox, you might like my previous article “The Inspection Paradox Is Everywhere“. And if you like thinking about probability, you might like the second edition of Think Bayes (affiliate link), which will be published by O’Reilly Media later this month.
If you want to see the details of my analysis and run the code, click here to run the notebook on Colab.
Finally, if you have access to standardized test scores at a college or university, and you are willing to compute a few statistics, I would love to compare my results with some real-world data. For students who enrolled, I would need
- Mean and standard deviation for each section of the SAT or ACT.
- Correlations between the sections.
The results, if you share them, would appear as a dot on a graph, either labeled or unlabeled at your discretion.