The Center Moves Faster Than You
In May 2022, Elon Musk tweeted this cartoon:
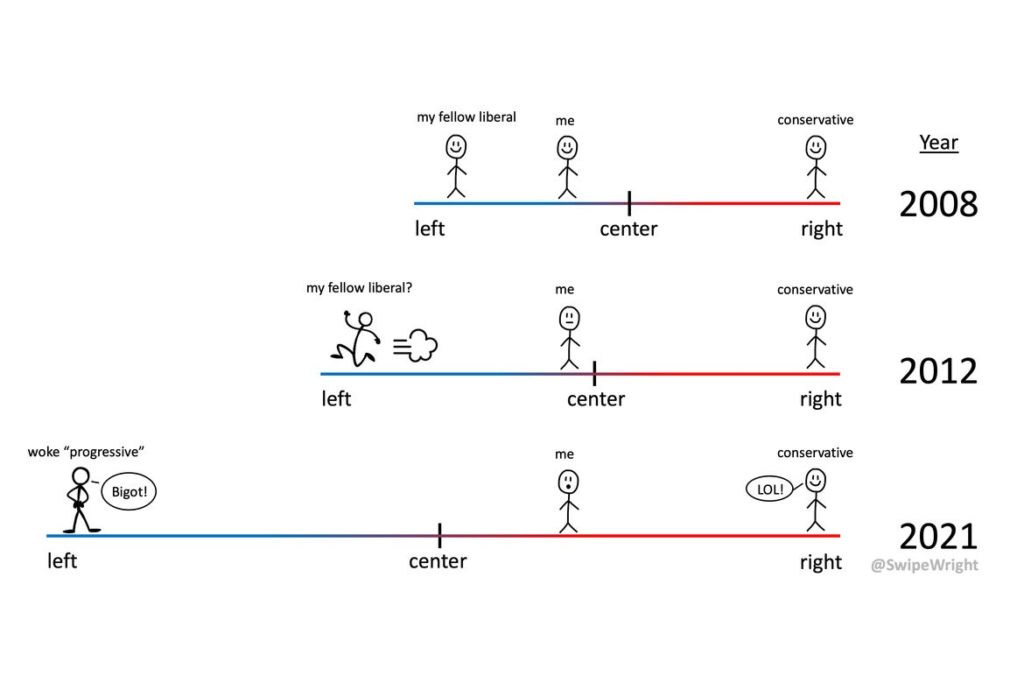
The creator of the cartoon, Colin Wright, explained it like this:
At the outset, I stand happily beside ‘my fellow liberal,’ who is slightly to my left. In 2012 he sprints to the left, dragging out the left end of the political spectrum […] and pulling the political “center” closer to me. By 2021 my fellow liberal is a “woke ‘progressive,’ ” so far to the left that I’m now right of center, even though I haven’t moved.”
The cartoon struck a chord, which suggests that Musk and Wright are not the only ones who feel this way.
As it happens, this phenomenon is the topic of Chapter 12 of Probably Overthinking It and this post from April 2023, where I use data from the General Social Survey to describe changes in political views over the last 50 years.
The chapter includes this figure, which shows how beliefs have changed among people who consider themselves conservative, moderate, and liberal.
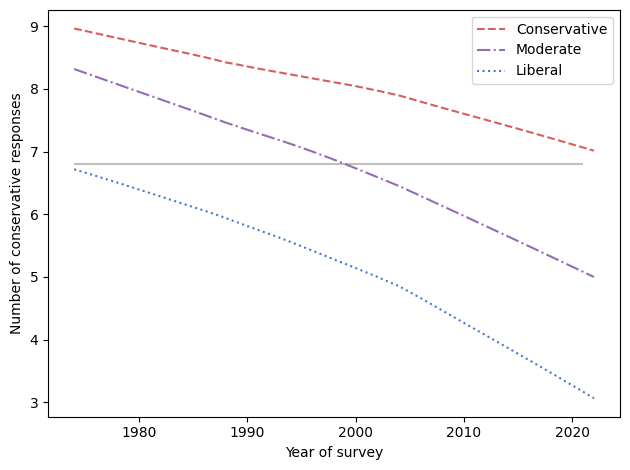
All three groups give fewer conservative responses to the survey questions over time. (To see how I identified conservative responses, see the talk I presented at PyData 2022. The technical details are in this Jupyter notebook.)
The gray line represents a hypothetical person whose views don’t change. In 1972, they were as liberal as the average liberal. In 2000, they were near the center. And in 2022, they were almost as conservative as the average conservative.
Using the same methods, I made this data-driven version of the cartoon.
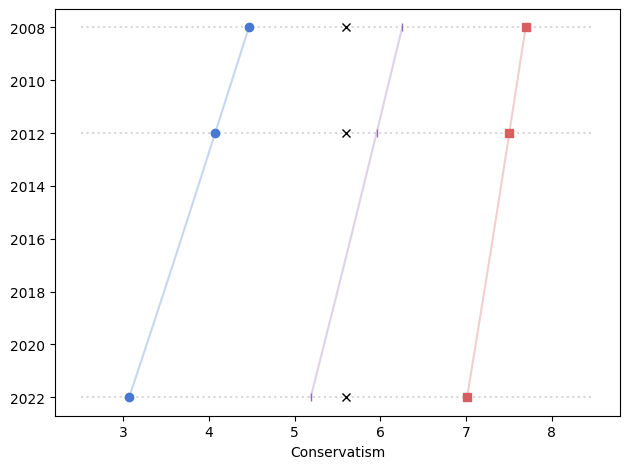
The blue circles show the estimated conservatism of the average self-identified liberal; the red squares show the average conservative, and the purple line shows the overall average.
The data validate Wright’s subjective experience. If you were a little left of center in 2008 and you did not change your views for 14 years, you would find yourself a little right of center in 2022.
However, the cartoon is misleading in one sense: the center did not shift because people on the left moved far to the left. It moved primarily because of generational replacement. On the conveyor belt of demography, when old people die, they are replaced by younger people — and younger people hold more liberal views.
On average people become a little more liberal as they age, but these changes are small and slow compared to generational replacement. That’s why many people have the experience reflected in the cartoon — because the center moves faster than them.
For more on this topic, you can read Chapter 12 of Probably Overthinking It. You can get a 30% discount if you order from the publisher and use the code UCPNEW. You can also order from Amazon or, if you want to support independent bookstores, from Bookshop.org.
Or you might like this talk I presented at PyData NYC, this podcast, and this online article at Brilliant.org.